Aboriginal and Torres Strait Islander – Northern Territory population
advertisement
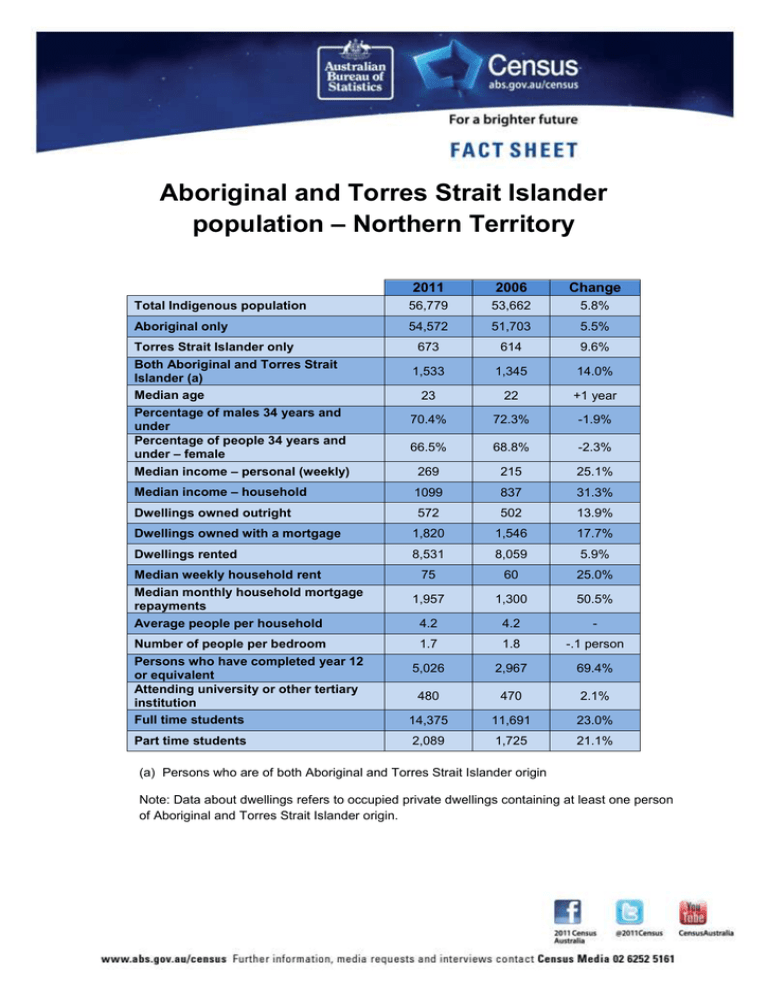
Aboriginal and Torres Strait Islander population – Northern Territory 2011 2006 Change Total Indigenous population 56,779 53,662 5.8% Aboriginal only 54,572 51,703 5.5% 673 614 9.6% 1,533 1,345 14.0% 23 22 +1 year 70.4% 72.3% -1.9% 66.5% 68.8% -2.3% 269 215 25.1% Median income – household 1099 837 31.3% Dwellings owned outright 572 502 13.9% Dwellings owned with a mortgage 1,820 1,546 17.7% Dwellings rented 8,531 8,059 5.9% 75 60 25.0% 1,957 1,300 50.5% 4.2 4.2 - 1.7 1.8 -.1 person 5,026 2,967 69.4% Torres Strait Islander only Both Aboriginal and Torres Strait Islander (a) Median age Percentage of males 34 years and under Percentage of people 34 years and under – female Median income – personal (weekly) Median weekly household rent Median monthly household mortgage repayments Average people per household Number of people per bedroom Persons who have completed year 12 or equivalent Attending university or other tertiary institution Full time students 480 470 2.1% 14,375 11,691 23.0% Part time students 2,089 1,725 21.1% (a) Persons who are of both Aboriginal and Torres Strait Islander origin Note: Data about dwellings refers to occupied private dwellings containing at least one person of Aboriginal and Torres Strait Islander origin.
