Gaz Metro Limited Partnership
advertisement
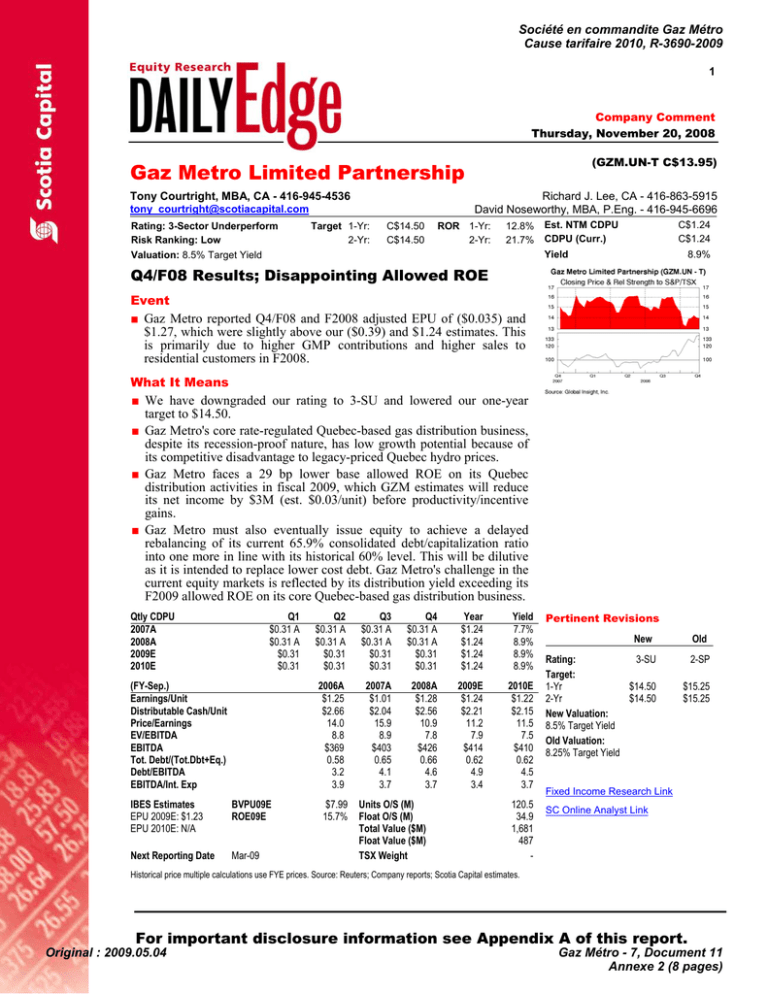
Société en commandite Gaz Métro Cause tarifaire 2010, R-3690-2009 1 Company Comment Thursday, November 20, 2008 (GZM.UN-T C$13.95) Gaz Metro Limited Partnership Tony Courtright, MBA, CA - 416-945-4536 Richard J. Lee, CA - 416-863-5915 David Noseworthy, MBA, P.Eng. - 416-945-6696 tony_courtright@scotiacapital.com Rating: 3-Sector Underperform Risk Ranking: Low Target 1-Yr: 2-Yr: C$14.50 C$14.50 ROR 1-Yr: 2-Yr: 12.8% 21.7% Est. NTM CDPU CDPU (Curr.) C$1.24 C$1.24 Yield Valuation: 8.5% Target Yield 8.9% Q4/F08 Results; Disappointing Allowed ROE Event ■ Gaz Metro reported Q4/F08 and F2008 adjusted EPU of ($0.035) and $1.27, which were slightly above our ($0.39) and $1.24 estimates. This is primarily due to higher GMP contributions and higher sales to residential customers in F2008. What It Means ■ We have downgraded our rating to 3-SU and lowered our one-year target to $14.50. ■ Gaz Metro's core rate-regulated Quebec-based gas distribution business, despite its recession-proof nature, has low growth potential because of its competitive disadvantage to legacy-priced Quebec hydro prices. ■ Gaz Metro faces a 29 bp lower base allowed ROE on its Quebec distribution activities in fiscal 2009, which GZM estimates will reduce its net income by $3M (est. $0.03/unit) before productivity/incentive gains. ■ Gaz Metro must also eventually issue equity to achieve a delayed rebalancing of its current 65.9% consolidated debt/capitalization ratio into one more in line with its historical 60% level. This will be dilutive as it is intended to replace lower cost debt. Gaz Metro's challenge in the current equity markets is reflected by its distribution yield exceeding its F2009 allowed ROE on its core Quebec-based gas distribution business. Qtly CDPU 2007A 2008A 2009E 2010E Q1 $0.31 A $0.31 A $0.31 $0.31 (FY-Sep.) Earnings/Unit Distributable Cash/Unit Price/Earnings EV/EBITDA EBITDA Tot. Debt/(Tot.Dbt+Eq.) Debt/EBITDA EBITDA/Int. Exp IBES Estimates EPU 2009E: $1.23 EPU 2010E: N/A BVPU09E ROE09E Next Reporting Date Mar-09 Q2 $0.31 A $0.31 A $0.31 $0.31 Q3 $0.31 A $0.31 A $0.31 $0.31 Q4 $0.31 A $0.31 A $0.31 $0.31 Year $1.24 $1.24 $1.24 $1.24 Yield 7.7% 8.9% 8.9% 8.9% 2006A $1.25 $2.66 14.0 8.8 $369 0.58 3.2 3.9 2007A $1.01 $2.04 15.9 8.9 $403 0.65 4.1 3.7 2008A $1.28 $2.56 10.9 7.8 $426 0.66 4.6 3.7 2009E $1.24 $2.21 11.2 7.9 $414 0.62 4.9 3.4 2010E $1.22 $2.15 11.5 7.5 $410 0.62 4.5 3.7 $7.99 15.7% Units O/S (M) Float O/S (M) Total Value ($M) Float Value ($M) TSX Weight 120.5 34.9 1,681 487 - Pertinent Revisions New Rating: 3-SU Target: 1-Yr $14.50 2-Yr $14.50 New Valuation: 8.5% Target Yield Old Valuation: 8.25% Target Yield Old 2-SP $15.25 $15.25 Fixed Income Research Link SC Online Analyst Link Historical price multiple calculations use FYE prices. Source: Reuters; Company reports; Scotia Capital estimates. For important disclosure information see Appendix A of this report. Original : 2009.05.04 Gaz Métro - 7, Document 11 Annexe 2 (8 pages) 2 Company Comment Thursday, November 20, 2008 O ct-0 8 Ma y-08 Ju l-0 7 D e c-0 7 F e b -0 7 Ap r-0 6 S e p -0 6 Ju n -0 5 N o v-0 5 Ja n -0 5 Au g -0 4 O ct-0 3 Ma r-0 4 Ma y-03 Ju l-0 2 D e c-0 2 F e b -0 2 Ap r-0 1 S e p -0 1 Ju n -0 0 N o v-0 0 No v 19 Recommendation ■ We reduce our rating to 3-Sector Underperform from 2-Sector Perform with a projected ROR of 12%, compared with 45% average of our universe of coverage. Source: TSX Group; Scotia Capital estimates. Oct-08 Sep-08 Aug-08 Jul-08 Jun-08 May-08 Apr-08 Mar-08 Feb-08 Jan-08 Dec-07 Dec-07 Nov-07 Oct-07 Sep-07 Aug-07 Yield (%) Ja n -0 0 Valuation ■ We reduce our target by $0.75 to $14.50, which is based on a 8.50% (previously 8.25%) Exhibit 1 – GZM Yield Spread Over GCAN 10-YR distribution yield. 7.00 (% ) ■ Gaz Metro units are currently trading at about 6.00 540 bp yield spread to prevailing 3.5% 10-year +3 S.D. Canada bond yields (Exhibit 1). In our view, the 5.00 current near record wide yield spread is due to +2 S.D. higher threshold returns required from equity 4.00 investors coupled with a flight to risk-free +1 S.D. investments (such as Canada government bonds). 3.00 Mean ■ Comparable Yield to BBB Corporate Bond: 2.00 Gaz Metro's current yield of 8.9% is comparable to that of an investor holding a long-term BBB-1 S.D 1.00 corporate bond (on pre-tax yield basis only). We note, however, an investor faces less risk and 0.00 benefits from a higher priority income claim by holding a corporate bond, compared to Gaz Metro's distributions which are likely to be G ZM Y ield S pread O ver G C AN 10-Y R reduced by 30% following the imposition of SIFT taxes in Jan 1, 2011. We believe the Source: Bloomberg; Scotia Capital estimates. relative yield compression between Gaz Metro's distribution and BBB corporate bond suggests Gaz Metro's unit prices might face some downward pressure, assuming the cost of Exhibit 2 – GZM Yield Spread Over Long BBB Corporate Bond borrowing remains historically high due to the 10 credit crisis. 9.5 Long BBB Corporate Yield Gaz Metro's Yield ■ Valuation Relative to Equities: Gaz Metro units 9 are currently trading at 16.4x EPU (2010E tax8.5 adjusted), which is at a premium relative to its 8 Canadian utility equities (weighted avg 14.6x 7.5 EPS 2010E - see Exhibit 3). We have assumed a simplifying 30% combined federal and Quebec 7 tax rate. In our view, Gaz Metro's tax-adjusted 6.5 P/E should trade at a par or at a discount to its 6 utility peers due to its limited growth 5.5 opportunities and lower retention of internal cash 5 flows to fund growth (which implies Gaz Metro's greater reliance on more costly equity markets). 3 Company Comment Thursday, November 20, 2008 Exhibit 3 - Valuation Comparable: Gaz Metro LP versus Canadian Equity Utilities Price/post-tax Earnings Utility Equities (1) Canadian Utilities Limited Emera Incorporated Enbridge Inc. Fortis Inc. 19-Nov-08 $ $ $ $ 40.22 20.39 35.70 25.78 Shares Market O/S Cap Yield 3.3% 4.7% 3.7% 3.9% 126 112 371 157 Weighted Average By Market Capitalization 3.7% (1) Estimates are from Scotia Capital's Utilities Analyst Sam Kanes Gaz Metro Lim ited Partnership $ 13.95 8.9% 121 (1) Assuming 30% combined federal and Quebec general corporate tax rate EV/2009E EBITDA EV/2010E EBITDA 5,048 2,281 13,259 4,051 7.7 x 7.4 x 9.9 x 8.5 x 7.5 x 7.2 x 9.4 x 8.2 x 24,639 9.0 x 8.6 x 1,681 7.7 x 7.8 x EPS 2009E $2.90 $1.39 $2.15 $1.63 EPS 2010E $3.00 $1.46 $2.35 $1.74 Pre-tax Earnings $1.24 $1.21 Pre-tax Earnings (1) $0.87 $0.85 Source: Scotia Capital estimates. Outlook/Developments ■ 8.76% F2009 ROE is second lowest authorized rate since 2004: On Nov 12/08, the Régie authorized base ROE at 8.76% for F2009, which was 49 bp lower than Gaz Métro's request for 9.25% and 29 bp lower than Gaz Metro's authorized ROE of 9.05% in F2008. We note this ROE is the second lowest rate rendered by the Regie since 2004 - the lowest ROE rendered since 2004 was 8.73% in 2007. We note, however, Gaz Metro's average yield during F2007 (which implies its cost of equity) of 7.4% was still lower than the Regie's authorized ROE of 8.73% for F2008. In contrast, Gaz Metro's current yield of 8.9% is 14 bp higher than the Regie's authorized ROE of 8.76% for F2009. Although the overall impact of the decision is not expected to be finalized before the end of Nov/08 (when Gaz Metro updates its application and files with the Regie), Gaz Metro indicated the 29 bp decrease in authorized ROE from prior year will otherwise cause F2009 annual net income to decrease by about $3M (or about $0.03/unit) from F2008 levels. ■ Equity issuance: Gaz Metro still needs to raise equity (est. $95M) to refinance its $225M acquisition of Green Mountain Power and $46M investment in Vermont Transco LLC. As at Sept 30, 2008, GZM's debt/total capitalization ratio is 65.9% (up from 61.9% in June 30, 2008). Gaz Metro now guides to issuing equity units "at an appropriate" time to bring its leverage ratio down to more historical levels (58%-61% range). For modelling purposes, we have delayed the timing of Gaz Metro's equity issuance from early Q1/F09 to Q4/F09 (i.e., July-Sept/09). We continue to assume a $95M equity issuance (about 6.5M units at our $14.50/unit target) which would bring down its debt/total capitalization ratio down to 60%. ■ Near-term debt refinancing: On Oct. 14/08, Gaz Metro raised $150M of Series L First Mortgage Bonds which bear interest at 5.4% per annum and mature on April 15, 2013. We expect Gaz Metro will need to refinance $100M in 2010 to replace GMI's Series H maturing debt balance. See Exhibit 4. ■ TQM/PNGTS transportation toll application: The National Energy Board's decision on TQM's application for 40% equity thickness and 11% ROE (retroactive to Jan 1/07) is expected to be announced in early 2009. FERC's decision on PNGTS' rate application and hearings are expected to start on March 10, 2009. 2009E 2010E 13.9 x 14.7 x 16.6 x 15.8 x 13.4 x 14.0 x 15.2 x 14.8 x 15.7 x 14.6 x Price/pre-tax Earnings 11.2 x 11.5 x Price/post-tax Earnings(1) 16.1 x 16.4 x 4 Company Comment Thursday, November 20, 2008 Exhibit 4 - Gaz Metro's LT Debt Summary Long-term Debt Maturity Schedule - Nov 1, 2008 Type Amount Interest Rates Maturity First Mortgage Bonds Series "D" $125 10.75% 2017 Series "E" $100 9.00% 2025 Series "F" $50 7.20% 2028 Series "H" $100 6.95% 2010 Series "I" $125 7.05% 2031 Series "I" $125 6.30% 2034 Series "J" $150 5.45% 2021 Series "J" $150 5.70% 2036 Series "L" - New Issuance on Oct 13/08 $150 5.40% 2013 Term Loan (5.05% in 2006) $238 3.57% 2010 to 2013 $1,313 NNEEC Unsecured Notes Series A US$50 5.93% 2017 Unsecured Notes Series B US$50 6.12% 2022 US$20 7.03% 2028 and 2036 Series 6.04% US$42 6.04% 2018 Series 6.70% US$15 6.70% 2019 Series 9.64% US$9 9.64% 2020 Series 8.65% US$13 8.65% 2022 Series 6.53% US$30 6.53% 2036 Series 6.17% US$16 6.17% 2038 Unsecured term loan and others US$21 3.00% 2011 and 2017 US$100 VSG Unsecured preferred notes (US 20,000) GMP First Mortgage Bonds US$43 TQM Bonds Series "H" $50 6.50% 2009 Series "I" $50 7.05% 2010 Series "J" $38 3.91% 2010 $21 3.40% 2011 5.54% 2010 to 2017 Term loan (4.72% in 2007) $159 Other Term loan and other (5.77% in 2007) $69 $1,704 Source: Company reports; Scotia Capital estimates. (toal assuming parity) 5 Company Comment Thursday, November 20, 2008 $120 $100 Jan-08 Feb-08 Mar-08 Apr-08 May-08 Jun-08 Aug-08 Sep-08 Oct-08 19 99 20 00 20 01 20 02 20 03 20 04 20 05 20 06 20 07 $80 $70 $60 $50 $40 Nov-08 Dec-07 19 98 Quebec Residential Housing Starts $90 40,000 30,000 20,000 10,000 E 20 09 20 08 E 0 Source: CMHC . SC Online Analyst Link Heavy Fuel Oil (No. 6 NY Cargo) $110 NG Prices (Empress) ■ Industrial Customers Conversion to Exhibit 5 - Natural Gas vs Heavy Fuel Oil Natural Gas: We believe the pace of industrial customers switching from heavy $12.00 fuel oil to natural gas as their energy source $11.00 may decline due to the recent crude oil price decline. (See Exhibit 5). Longer-term, we $10.00 expect many industrial customers to switch gradually from heavy fuel oil to natural gas $9.00 because of growing regulatory restrictions on greenhouse gas emissions. As such, the $8.00 general trend of switching from heavy fuel $7.00 oil to natural gas remains favourable and likely represents a long-term growth $6.00 Heavy Fuel Oil opportunity for Gaz Metro. Gaz Metro Price Drop estimates a potential for 15 Bcf (or about $5.00 7.5% of Quebec's total gas consumption in 2007) could be added to Gaz Metro's QDA $4.00 industrial customer base over the long-term. ■ New Home Construction to Moderate in 2009: New housing starts in Quebec are Natural Gas (Empress) Heavy Fuel Oil (No. 6 NY Cargo) expected to moderate near-term, which will likely reduce the growth of Gaz Metro's QDA residential customer base. According Source: Bloomberg (using Empress Natural Gas and No. 6 Fuel Oil (NY Cargo) to Canadian Mortgage and Housing . Corporation (CMHC), new home construction is expected to decrease from Exhibit 6 - Quebec Housing Starts for 2008E and 2009E 48,553 units in 2007 to 47,938 (-1.3% YOY 70,000 decrease) in 2008 and to 42,000 (-12.4% YOY decrease) in 2009 (Exhibit 6). We 60,000 expect relatively flat residential gas volume deliveries by Gaz Metro over the next two 50,000 years. 6 Company Comment Thursday, November 20, 2008 Appendix A: Important Disclosures Company Gaz Metro Limited Partnership Ticker GZM.UN Disclosures* U I, Tony Courtright, certify that (1) the views expressed in this report in connection with securities or issuers that I analyze accurately reflect my personal views and (2) no part of my compensation was, is, or will be directly or indirectly, related to the specific recommendations or views expressed by me in this report. The Fundamental Research Analysts' compensation is based on various performance and market criteria and is charged as an expense to certain departments of Scotia Capital Inc., including investment banking. Scotia Capital Inc. and/or its affiliates: expects to receive or intends to seek compensation for investment banking services from issuers covered in this report within the next three months; and has or seeks a business relationship with the issuers referred to herein which involves providing services, other than securities underwriting or advisory services, for which compensation is or may be received. These may include services relating to lending, cash management, foreign exchange, securities trading, derivatives, structured finance or precious metals. This report may include articles or content prepared by Scotia Economics as a resource for the clients of Scotiabank and Scotia Capital. For Scotia Capital Research analyst standards and disclosure policies, please visit http://www.scotiacapital.com/disclosures * U Legend Within the last 12 months, Scotia Capital Inc. and/or its affiliates have undertaken an underwriting liability with respect to equity or debt securities of, or have provided advice for a fee with respect to, this issuer. 7 Company Comment Thursday, November 20, 2008 Definition of Scotia Capital Equity Research Ratings & Risk Rankings We have a three-tiered rating system, with ratings of 1-Sector Outperform, 2-Sector Perform, and 3-Sector Underperform. Each analyst assigns a rating that is relative to his or her coverage universe. Our risk ranking system provides transparency as to the underlying financial and operational risk of each stock covered. Statistical and judgmental factors considered are: historical financial results, share price volatility, liquidity of the shares, credit ratings, analyst forecasts, consistency and predictability of earnings, EPS growth, dividends, cash flow from operations, and strength of balance sheet. The Director of Research and the Supervisory Analyst jointly make the final determination of all risk rankings. Ratings Risk Rankings 1-Sector Outperform The stock is expected to outperform the average total return of the analyst’s coverage universe by sector over the next 12 months. Low Low financial and operational risk, high predictability of financial results, low stock volatility. 2-Sector Perform The stock is expected to perform approximately in line with the average total return of the analyst’s coverage universe by sector over the next 12 months. Medium Moderate financial and operational risk, moderate predictability of financial results, moderate stock volatility. 3-Sector Underperform The stock is expected to underperform the average total return of the analyst’s coverage universe by sector over the next 12 months. Other Ratings Tender – Investors are guided to tender to the terms of the takeover offer. Under Review – The rating has been temporarily placed under review, until sufficient information has been received and assessed by the analyst. High High financial and/or operational risk, low predictability of financial results, high stock volatility. Caution Warranted Exceptionally high financial and/or operational risk, exceptionally low predictability of financial results, exceptionally high stock volatility. For risktolerant investors only. Venture Risk and return consistent with Venture Capital. For risk-tolerant investors only. Scotia Capital Equity Research Ratings Distribution* Distribution by Ratings and Equity and Equity-Related Financings* Percentage of companies covered by Scotia Capital Equity Research within each rating category. Percentage of companies within each rating category for which Scotia Capital has undertaken an underwriting liability or has provided advice for a fee within the last 12 months. Source: Scotia Capital. For the purposes of the ratings distribution disclosure the NASD requires members who use a ratings system with terms different than “buy,” “hold/neutral” and “sell,” to equate their own ratings into these categories. Our 1-Sector Outperform, 2-Sector Perform, and 3-Sector Underperform ratings are based on the criteria above, but for this purpose could be equated to buy, neutral and sell ratings, respectively. 8 Company Comment Thursday, November 20, 2008 Disclaimer This report has been prepared by SCOTIA CAPITAL INC. (SCI), a subsidiary of the Bank of Nova Scotia. Opinions, estimates and projections contained herein are our own as of the date hereof and are subject to change without notice. The information and opinions contained herein have been compiled or arrived at from sources believed reliable but no representation or warranty, express or implied, is made as to their accuracy or completeness. Neither SCI nor its affiliates accepts any liability whatsoever for any loss arising from any use of this report or its contents. This report is not, and is not to be construed as, an offer to sell or solicitation of an offer to buy any securities and/or commodity futures contracts. The securities mentioned in this report may not be suitable for all investors nor eligible for sale in some jurisdictions. This research and all the information, opinions, and conclusions contained in it are protected by copyright. This report may not be reproduced in whole or in part, or referred to in any manner whatsoever, nor may the information, opinions, and conclusions contained in it be referred to without the prior express consent of SCI. SCI is authorized and regulated by The Financial Services Authority. U.S. Residents: Scotia Capital (USA) Inc., a wholly owned subsidiary of SCI, accepts responsibility for the contents herein, subject to the terms and limitations set out above. Any U.S. person wishing further information or to effect transactions in any security discussed herein should contact Scotia Capital (USA) Inc. at 212-225-6500.
