Document 12209074
advertisement
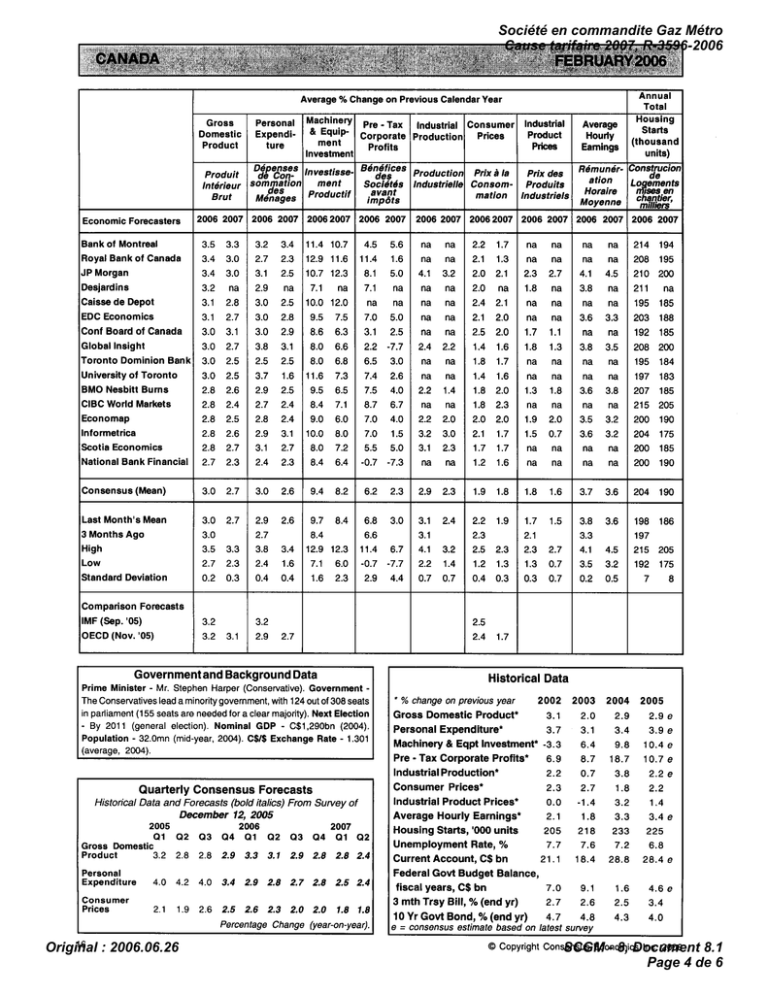
Société en commandite Gaz Métro Cause tarifaire 2007, R-3596-2006 Annual Total Average % Change on Previous Calendar Year - Personal Machinery Pre Tax Expendi- & EqU'p- Corporate ture profits Investment Benefices Depenses InvestisseProduit de Condes Societds Interieur ~ ~ m m a t i o nmerit avant Productif ~~~t impdts Gross Domestic Product Industrial Consumer Industrial Product Production Prices Prices Average Hourly Eamings Starts (thousand units) Construcion RemunerProduction Prix la Prix des de LO ements lndustrielle Consom- Produits mation Industriels n&ses chantier, en Moyenne HOraire milliers 2006 2007 2006 2007 2006 2007 2006 2007 2006 2007 2006 2007 2006 2007 2006 2007 2006 2007 MCeges Economic Forecasters Bank of Montreal Royal Bank of Canada JP Morgan Desjardins Caisse de Depot EDC Economics ConfBoardofCanada Global Insight Toronto Dominion Bank University of Toronto BMO Nesbitt Burns ClBC World Markets Economap lnformetrica Scotia Economics National Bank Financial 3.5 3.3 3.0 3.2 2.7 3.4 2.3 11.4 10.7 3.4 12.9 11.6 4.5 11.4 5.6 1.6 3.4 3.0 3.1 2.5 10.7 12.3 8.1 5.0 3.2 na 2.9 na na 7.1 na 3.1 2.8 3.0 2.5 10.0 12.0 na na 3.1 2.7 3.0 2.8 9.5 7.5 3.0 3.1 3.0 2.9 8.6 6.3 7.0 3.1 5.0 2.5 3.0 2.7 3.8 3.1 8.0 6.6 2.2 3.0 2.5 2.5 2.5 8.0 6.8 6.5 3.0 2.5 3.7 1.6 11.6 7.3 2.8 2.8 2.6 2.4 2.9 2.7 2.5 2.4 9.5 8.4 6.5 7.1 2.8 2.5 2.8 2.4 9.0 6.0 2.8 2.8 2.6 2.7 2.9 3.1 3.1 2.7 10.0 8.0 2.7 2.3 2.4 2.3 Consensus (Mean) 3.0 2.7 3.0 2.6 Last Month's Mean 3.0 2.7 2.9 2.6 3 Months Ago High 3.0 3.5 2.7 3.3 2.3 0.2 3.2 3.2 LOW Standard Deviation Comparison Forecasts IMF (Sep. '05) OECD (Nov. '05) na na 4.1 na na 3.2 2.2 1.7 2.1 1.3 2.0 na na na na -7.7 na na 2.4 3.0 7.4 2.6 7.5 4.0 8.7 6.7 na 7.0 4.0 2.2 8.0 7.2 7.0 5.5 1.5 5.0 8.4 6.4 -0.7 9.4 8.2 9.7 8.4 7.1 8.4 12.9 12.3 2.1 na na 2.7 na na 4.1 na na 4.5 2.0 na 1.8 na 3.8 na 211 2.4 2.1 na na na na 195 185 na na 2.2 2.1 2.0 na 1.1 3.3 2.0 na 1.7 3.6 2.5 na na 203 188 192 185 1.4 1.6 1.8 1.3 3.8 3.5 na na 1.8 1.7 na na na na na 2.2 na 1.4 1.6 2.0 2.3 na 3.6 na 3.8 na 1.4 1.8 1.8 2.0 2.0 3.2 3.1 3.0 2.3 -7.3 na 6.2 2.3 6.8 6.6 11.4 2.0 2.1 1.7 1.7 1.7 1.5 na na 1.2 1.6 2.9 2.3 1.9 3.0 3.1 2.4 6.7 3.2 1.4 0.7 3.4 2.4 1.6 7.1 6.0 -0.7 -7.7 0.3 0.4 0.4 1.6 2.3 2.9 4.4 0.7 3.1 3.2 2.9 2.7 Quarterly Consensus Forecasts Historical Data and Forecasts (bold italics) From Survey o f December 12, 2005 Q3 Q4 2006 Q1 Q2 2.8 2.9 3.3 Personal Expenditure 4.0 4.2 4.0 3.4 Consumer Prices 2.1 3.1 195 210 200 na 208 200 195 184 na na 197 183 207 185 215 205 3.5 3.2 200 190 0.7 na 3.6 na 3.2 na 204 200 175 185 na na na na 200 190 1.8 1.8 1.6 3.7 3.6 204 190 2.2 1.9 2.7 3.8 3.3 4.1 3.6 2.3 1.7 2.1 2.3 1.5 2.3 2.5 4.5 198 186 197 215 205 1.2 1.3 1.3 0.7 3.5 3.2 192 175 0.4 0.3 0.3 0.7 0.2 0.5 2.4 - 2005 Q1 Q2 Gross Domestic 3.2 2.8 Product 208 7 8 2.5 Governmentand BackgroundData 0 3 Q4 2007 Q1 Q2 2.9 2.8 2.8 2.4 2.9 2.8 2.7 2.8 2.5 2.4 2.5 2.6 2.3 2.0 2.0 1.8 1.8 Percentage Change (year-on-year). 16 : 2006.06.26 Original na 1.8 na 2.0 3.1 4.1 2.2 Prime Minister - Mr. Stephen Harper (Conservative). Government The Conservatives lead a minoritygovernment, with 124 out of 308 seats in parliament (155 seats are needed for a clear majority). Next Election By 201 1 (general election). Nominal GDP C$1,290bn (2004). Population - 32.0mn (mid-year, 2004). C$/$ Exchange Rate - 1.301 (average, 2004). 1.9 2.6 na 1.3 na 1.9 2.7 3.8 - 214 194 na na 2.3 1.7 Historical Data % change on previous year 2002 Gross Domestic Product* 3.1 Personal Expenditure* 3.7 Machinery & Eqpt Investment* -3.3 Pre-TaxCorporateProfits* 6.9 Industrial Production* 2.2 Consumer Prices* 2.3 Industrial Product Prices* 0.0 Average Hourly Earnings* 2.1 Housing Starts, '000 units 205 Unemployment Rate, % 7.7 Current Account, C$ bn 21.1 Federal Govt Budget Balance, fiscal years, C$ bn 7.0 3 mth Trsy Bill, %(end yr) 2.7 2003 2004 2.0 2.9 2005 3.1 3.4 3.9 e 6.4 9.8 10.4 e 8.7 0.7 18.7 3.8 10.7e 2.2 e 2.9 e 2.7 1.8 2.2 -1.4 1.8 3.2 3.3 1.4 3.4 e 21 8 7.6 233 7.2 225 6.8 18.4 28.8 28.4 e 9.1 2.6 1.6 2.5 4.6 e 3.4 10 Yr Govt Bond, % (end yr) 4.7 4.8 e = consensus estimate based on latest survey 4.3 4.0 O Copyright Consensus Economics Inc. 2006 SCGM - 8, Document 8.1 Page 4 de 6 Société en commandite Gaz Métro Cause tarifaire 2007, R-3596-2006 Election Results Suggest Little Change i n Outlook Our panel's relatively upbeat outlook remains largely unchanged from last month's survey, despite the Bank of Canada raising its overnight rate by 25 basis pointsto 3.50% on January 24, coupled with a general election upset forthe Liberals. Economic policy, however, is unlikely to change markedly, given that the Conservative-ledgovernment needs to garnercross-partysupport in order to legislateeffectively. Much-promisedtaxcuts, though, are likely to see the federal budget surplus shrink, as highlighted by the consensus. Moreover, a reduction in taxes could support consumer spending. Retail trade helped to lift overall GDP growth in November, with sales soaring by 1.3% m-o-m, compared with 1.6% in October. Excluding auto trade - which surged by 3.1%in both m-o-mand y-o-yterms-sales still managed to advance by 0.6% on the back of gains in clothing and supermarket shopping. Elsewhere, payrolls increased by 26,000 in December, althoughthe unemployment rateedged up from 6.5% to 6.6% as more people entered the labour force. Our panel's expectationsforthe jobless rate this year have increased as a result. A 6.6% m-o-m surge in new housing starts in December has furtherbrightenedthe outlook for domestic demand and, consequently, the 2006 forecast for personal expenditure has risen. lnflation pressures, meanwhile, remain muted, with prices declining by0.5% mo-m in October, 0.2% in November and 0.1% in December, bringing the y-o-y trend down from 2.6% in Octoberto 2.2% at the end of last year. Core inflationhas also eased, showing little significant pass-through from last year's soaring energy prices. Consumer price forecasts have been downgraded but, with the labour and housing markets firm, the Bank of Canada remains vigilant. Indeed,our panelforesees an 83% chance of another rate hike. Direction of Trade - First Half 2005 Major Export Markets Major Import Suppliers (% of Total) (% of Total) United States Japan United Kingdom Asia (ex. Japan) Latin America Middle East % - 84.3 2.1 1.8 4.0 1.7 0.6 United States China Japan Asia (ex. Japan) Latin America Africa 58.2 6.9 3.9 12.3 6.5 1.5 Real Growth and Inflation 86 87 88 69 90 91 92 93 94 95 96 97 98 99 00 01 02 03 04 05 06 07 06 09 10 Real GDP (% chg yoy) --- Consumer Prices (% chg yoy) O Copyright Consensus Economics Inc. 2006 Original : 2006.06.26 Manufacturing shipments and new orders fell sharply in November as a result of lower oil and coal prices. Moreover, industrial production contracted by 0.2% m-o-m during the same month on the backof a0.3% decline in manufacturing. Exporters, however, remain resilient, despite last year's strong C$, with exports reaching C$41.3bn at the end of 2005. This year's industrial production forecasts, however, have slipped. .. Likelihood of a Bank of Canada lnterest Rate Change lour panel's estimated average probability of a change inthe overnight lending rate (3.50% on survey date)at or before the next key policy meeting following the survey date is: I I I INCREASE Most likely % NOCHANGE DECREASE rate change mentioned: +0.25% Short- and Long-Term Interest Rates - 3 Mth Treasury Bill Rate - - - 10 Yr Govt Bond Yield SCGM - 8, Document 8.1 Page 5 de 6

