Improving hydrological model representation of alpine snowcover depletion and snowmelt runoff generation
advertisement
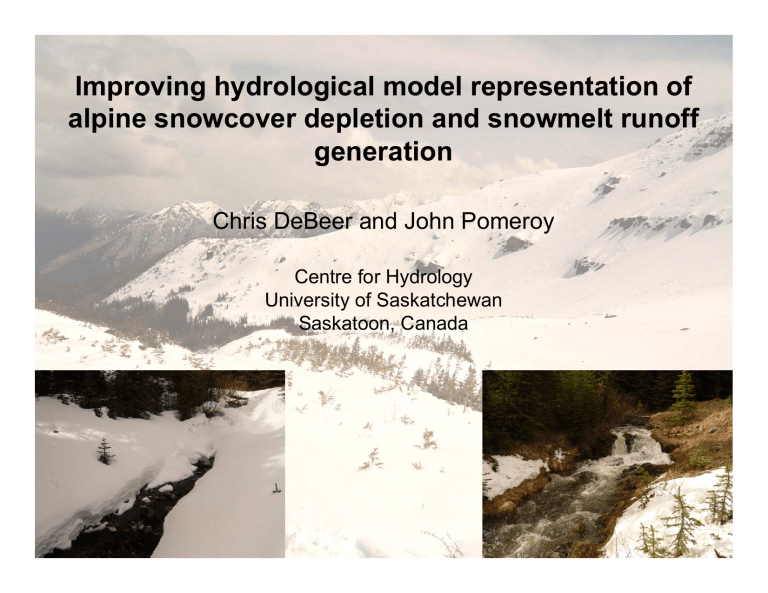
Improving hydrological model representation of alpine snowcover depletion and snowmelt runoff generation Chris DeBeer and John Pomeroy Centre for Hydrology University of Saskatchewan Saskatoon, Canada Background • Late winter alpine snowcover has high spatial variability in depth, energy state, and SWE • Together with spatial variation in melt energy, this leads to patchy snowcover and variable runoff contribution • Important to represent this variability in hydrological models and land surface schemes • Disaggregating terrain into slope and aspect based units can resolve much of the variability for modelling Background • Approach is to apply slope-corrected melt rates to SWE distribution on each landscape unit to derive snowcover depletion curve 0.02 0 0 75 150 SWE (mm) 225 Ma p(SWE)dSWE 1 300 40 mm/d 225 150 SCA Fraction p(SWE) 0.04 ∫ Accumulated Melt (mm) Relative Frequency SCA = ∞ 20 mm/d 75 10 mm/d 0 SCD curve 0.75 0.5 0.25 0 0 2 4 6 8 Days 10 12 14 0 2 4 6 8 Days 10 12 14 Background • However, melt timing and rates are non-uniform, even within a landscape unit • Important to consider internal processes in the snowpack when applying the energy balance principle in physically based models – e.g., internal energy, refreezing overnight – Depends on depth and density, so varies over SWE distribution • Oversimplifying to assume uniform melt and runoff generation over a distribution of SWE Objectives • Examine small scale variation in melt timing and rates due to variation in SWE depth in a sparsely vegetated alpine environment • Determine the effect of this variation on simulated snowcover depletion and meltwater runoff generation • Suggest an approach for improving the representation of small scale snowmelt variability in hydrological models Study Site • Fisera Ridge and Upper Middle Creek Basin Areal Snowcover Observations Time lapse digital photography used to monitor areal snowcover depletion May 13, June July 1, 4, 9, 10, 14, 17, 19, 22, 26, 29, 31, 7, 2,2007 4, 7, 10, 13, 18, 21, 24, 27, 2007 2007 2007 2007 2007 Snowmelt Modelling and Validation • Point location snowmelt modelling and observation – snow depth and temperature monitoring on slopes – Melt rates simulated using Snobal module in Cold Regions Hydrological Model (Qm = LVE + H - K↑ + K↓ + L↓ - L↑ + G - dU/dt) LvE H K↑ K↓ L↓ L↑ Soil layer E U Active layer Lower layer P U G R Snowmelt Modelling and Validation South-east facing site North facing site Simulated depth (m) 2 1 0 1-Apr 15-Apr 29-Apr 13-May 27-May 10-Jun Simulated depth (m) 0.5 0 1-Apr 24-Jun Simulated SWE (mm) Measured SWE (mm) 600 300 0 1-Apr 15-Apr 29-Apr 13-May 27-May 10-Jun 24-Jun 15-Apr 29-Apr 13-May 27-May 10-Jun Date (2008) 24-Jun Snow temp (°C) Snow temp (°C) Measured active layer T Simulated lower layer T Measured lower layer T -25 1-Apr 24-Jun Simulated SWE (mm) Measured SWE (mm) 100 0 1-Apr 15-Apr 29-Apr 13-May 27-May 10-Jun 24-Jun Date (2008) Simulated active layer T -15 29-Apr 13-May 27-May 10-Jun 200 Date (2008) -5 15-Apr Date (2008) Depth (mm) Depth (mm) Date (2008) 900 Measured depth (m) 1 Depth (m) Depth (m) Measured depth (m) -5 Simulated active layer T Measured active layer T -15 -25 1-Apr Simulated lower layer T Measured lower layer T 15-Apr 29-Apr 13-May 27-May 10-Jun 24-Jun Date (2008) Simulated Snowmelt Variation South-east facing site North facing site Time-dependent small scale associations between melt rate and SWE due to more rapid warming of shallow snow. Associations change later in melt period as all snow is ripe. Effects on SCD and Runoff Contributing Area South facing slope • • SWE distributions measured by surveys and repeat LiDAR SCD simulated by applying both uniform melt and inhomogeneous melt for different SWE classes Snowmelt runoff contributing area defined as fraction of basin generating runoff > 5 mm/d 1 Area fraction • Simulated Melt rates used to predict SCD in adjacent cirque basin 0.8 simulated SCD (In) 0.6 simulated SCD (U) 0.4 observed SCD 0.2 SRCA 0 r r r r y ay ay Ap Ap Ap Ap - Ma M M 2 4 6 24 26 28 30 Date (2008) North facing slope 1 Area fraction • 0.8 simulated SCD (In) 0.6 simulated SCD (U) 0.4 observed SCD 0.2 SRCA 0 r r r r ay ay ay Ap Ap Ap Ap M M M 2 4 6 24 28 26 30 Date (2008) Effects on SCD and Runoff Contributing Area • Spatial distributions of snow depth from LiDAR used to map spatial patterns of SCD and SRCA • Differences in melt and SWE distributions control the spatial development of the snowmelt runoff contributing area Effects on SCD and Runoff Contributing Area 1 0.8 Area fraction South facing slope simulated SCD (In) simulated SCD (U) 0.6 0.4 observed SCD 0.2 SRCA 0 r Ap 24 ay M 1 ay M 8 -M 15 ay -M 22 ay -M 29 ay n Ju 5- un -J 2 1 un -J 9 1 un -J 6 2 l Ju 3 Date (2008) 1 0.8 Area fraction North facing slope simulated SCD (In) simulated SCD (U) 0.6 0.4 observed SCD 0.2 SRCA 0 r Ap 24 ay M 1 ay M 8 -M 15 ay -M 22 ay -M 29 ay n Ju 5- Date (2008) un -J 2 1 un -J 9 1 un -J 6 2 l Ju 3 Effects on SCD and Runoff Contributing Area • Results from each slope were aggregated to derive basin scale snowcover depletion and runoff contributing area 1 simulated SCD (In) Area fraction 0.8 simulated SCD (U) 0.6 0.4 observed SCD 0.2 SRCA 0 r Ap 24 ay M 1- ay M 8- -M 15 ay -M 22 ay -M 29 ay n Ju 5- Date (2008) n Ju 12 n Ju 19 n Ju 26 l Ju 3 Snowmelt Runoff Simulation • This framework can be applied to simulate the meltwater inputs over the basin – Inputs to each slope computed by running the model in point mode for various initial SWE depth classes over the distribution – Simulated outflow from the base of the pack weighted by the fraction of the total distribution in each SWE class, and aggregated on each slope unit Snowmelt Runoff Simulation – Rate and timing of melt input over the basin is sensitive to approach, with significant implications for the snowmelt hydrograph 400 300 lumped basin and uniform melt 0.4 lumped basin and inhomogeneous melt 3 500 0.5 distributed basin and inhomogeneous melt 0.3 measured hydrograph 0.2 200 0.1 100 0 1-Apr-09 Discharge rate (m /s) Cumulative melt input (mm)a 600 0 21-Apr-09 11-May-09 31-May-09 20-Jun-09 10-Jul-09 Date 30-Jul-09 Conclusions • Snowmelt timing and rate is non-uniform, even within individual landscape units, due to differences in the internal energetics and ripening of the snow • Effect of initial SWE depth on melt rates is pronounced in early melt period with major implications for areal SCD • Simulations of areal snowcover depletion and snowmelt runoff generation can be improved by considering separate SWE classes on individual slopes • By improving the representation of melt inputs over the landscape, the snowmelt hydrograph can likely be more accurately simulated
