The American Freshman National Norms for Fall 2008
advertisement
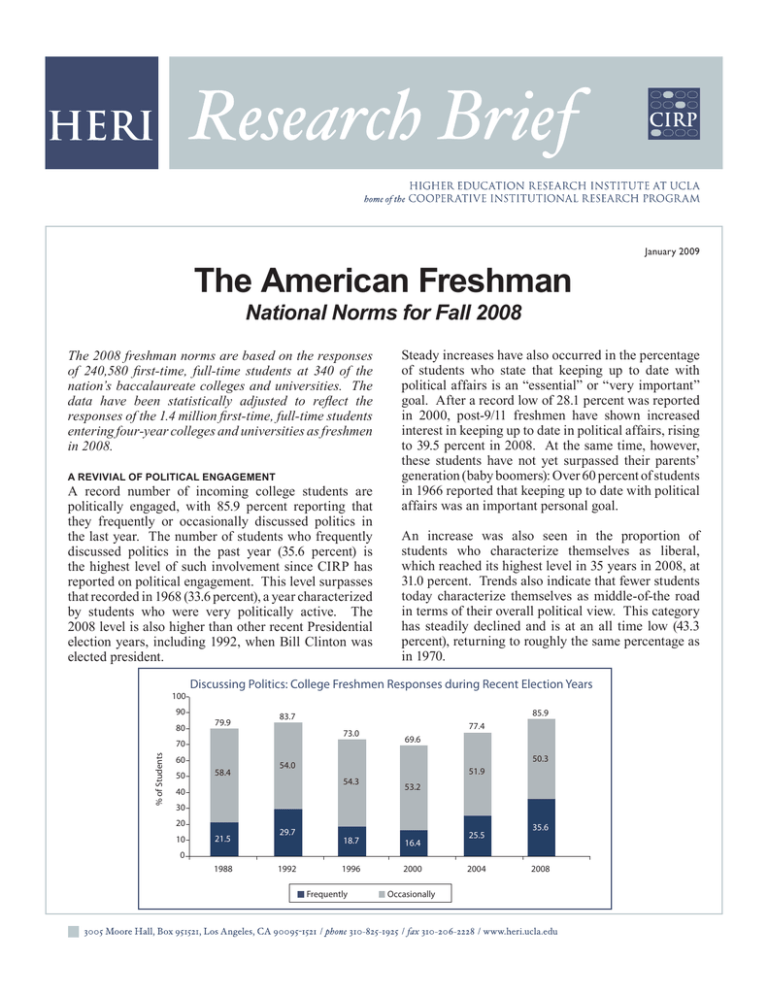
January 2009 The American Freshman National Norms for Fall 2008 The 2008 freshman norms are based on the responses of 240,580 first-time, full-time students at 340 of the nation’s baccalaureate colleges and universities. The data have been statistically adjusted to reflect the responses of the 1.4 million first-time, full-time students entering four-year colleges and universities as freshmen in 2008. A REVIVIAL OF POLITICAL ENGAGEMENT A record number of incoming college students are politically engaged, with 85.9 percent reporting that they frequently or occasionally discussed politics in the last year. The number of students who frequently discussed politics in the past year (35.6 percent) is the highest level of such involvement since CIRP has reported on political engagement. This level surpasses that recorded in 1968 (33.6 percent), a year characterized by students who were very politically active. The 2008 level is also higher than other recent Presidential election years, including 1992, when Bill Clinton was elected president. 100 90 80 % of Students An increase was also seen in the proportion of students who characterize themselves as liberal, which reached its highest level in 35 years in 2008, at 31.0 percent. Trends also indicate that fewer students today characterize themselves as middle-of-the road in terms of their overall political view. This category has steadily declined and is at an all time low (43.3 percent), returning to roughly the same percentage as in 1970. Discussing Politics: College Freshmen Responses during Recent Election Years 79.9 60 58.4 85.9 83.7 73.0 70 50 Steady increases have also occurred in the percentage of students who state that keeping up to date with political affairs is an “essential” or “very important” goal. After a record low of 28.1 percent was reported in 2000, post-9/11 freshmen have shown increased interest in keeping up to date in political affairs, rising to 39.5 percent in 2008. At the same time, however, these students have not yet surpassed their parents’ generation (baby boomers): Over 60 percent of students in 1966 reported that keeping up to date with political affairs was an important personal goal. 77.4 69.6 50.3 54.0 54.3 40 51.9 53.2 30 20 10 21.5 29.7 18.7 16.4 1996 2000 25.5 35.6 0 1988 1992 Frequently Occasionally 2004 2008 COLLEGE CHOICE AND FINANCIAL ISSUES The number of students attending their first-choice college continues to decline, dropping from 63.9 percent in 2007 to a 34-year low of 60.7 percent in 2008. Although this percentage was fairly stable from 1989 to 2005, hovering around 70 percent, it started a decline in 2006 that has only continued. up 3.1 percentage points from 2007. Additionally, 8.5 percent specifically reported that not receiving aid from their first choice college was very important in choosing where to attend, up 1.1 percent from 2007 and the highest percentage since the question was first asked in 1984. % of Students % of Students Today’s incoming students are more likely to look to multiple Trends in Students Attending Their First-Choice College income sources to pay for college. (% indicating “yes”) Family resources (e.g., parents, 100 relatives) are still the most likely source of funds, with 79.6 80 percent of students reporting that they will use family resources. 60 Incoming first-year students in 40 Is this college your 2008, however, are more likely to first choice? report using their own savings and 20 planning to work while in college than in previous years (64.7 0 percent in 2008). In fact, more 1972 1975 1978 1981 1984 1987 1990 1993 1996 1999 2002 2005 2008 students report that they will get a job in order to meet expenses while in college (49.4 percent in 2008) than in the 32 The percentage of incoming first-year students who years CIRP surveys have asked the question. They were accepted by their first-choice college also declined are also more likely to be receiving funds from aid from 2007 (80.6 percent) to 2008 (77.8 percent). It that need not be repaid, such as grants or scholarships remains the case that there is a gap between acceptances (69.3 in 2008). Planning ahead to use multiple sources, at first-choice colleges and actual attendance, and that as well as making the decision to attend a different gap is increasing – from 16.5 percent in 2007 to 17.1 college based upon financial circumstances, may percent in 2008. In terms of applications to college, explain why although financial issues drive college students applying to four or more colleges reached a choice for some students, we are not seeing larger record high in 2008, moving up to 60.1 percent from changes in the percentages of students concerned 56.4 percent in 2007. about their ability to pay for college. Financial concerns are increasingly the force that drives a student to decline Trends in Financial Reasons Influencing Students’ Decision a first-choice college in to Attend Their Chosen Institution favor of a second choice. (% indicating reason as “very important”) More students report that being offered financial aid 50 I was offered financial assistance was a “very important” or I was not offered aid by my first choice “essential” consideration 40 The cost of attending this college in choosing which school to attend than at any time 30 in the past 36 years the question has been asked; 20 from 2007 to 2008 alone, the percentage jumped 10 from 39.7 percent to 43.0 percent. The importance of the cost of attending the 0 chosen college is also at a 1972 1975 1978 1981 1984 1987 1990 1993 1996 1999 2002 2005 2008 high, at 39.9 percent, and COLLEGE READINESS BY CORE HIGH SCHOOL SUBJECT AREAS Nearly 100 percent of incoming freshmen met the required number of years of study in English, math, and history/American government. The story is different for the sciences. Since this set of questions was first asked on the 1984 CIRP Freshman Survey, the lowest level of achievement in terms of meeting college readiness has been completing two years of high school study in biological sciences. Although this is still the case, we see a new record of 49.5 percent in 2008, up from 46.8 percent in 2006. College Readiness* in Core High School Subject Areas, by Race/Ethnicity (percentages) White African American American Indian Asian/PI American Latino/a Multi-Racial American Other Total English Math 98.2 96.9 95.6 97.3 98.2 98.2 96.4 97.9 98.6 97.8 94.3 99.1 98.1 98.3 98.4 98.5 History/ Physical Biological American Computer Sciences Sciences Govt Science 63.2 48.0 49.4 67.3 59.8 61.3 66.9 61.8 49.3 43.7 47.3 57.6 47.5 49.7 53.3 49.5 99.3 97.1 97.4 98.4 98.9 99.0 97.7 98.9 61.7 61.4 69.5 52.0 61.4 59.3 61.0 60.8 Note: PI = Pacific Islander * = College Readiness in each subject area is as follows: 4 or more years of English, 3 or more years of math, 2 or more years of physical science and biological science, 1 or more years of history/American government, 1/2 or more years of computer science Perhaps more importantly, there are some distinct differences by race/ethnicity in the years of high school study devoted to core subject areas, particularly in the areas of physical and biological sciences. In the physical sciences only 48.0 percent of African American, 49.4 percent of American Indian, and 59.8 percent of Latino/a freshmen report that they have completed two years of study in high school. In contrast, 63.2 percent of White freshmen and 67.3 percent of Asian American/Pacific Islanders freshmen report that they completed two years of study in this area. Interest in engineering has also rebounded from the decade low of 7.5 percent (for the major), and 6.2 percent (for probable career) reported in 2007. A threeyear decline was reversed in 2008, with 9.4 percent of freshmen reporting interest in the major and 7.4 percent expressing interest in engineering as a probable career. SKILLS FOR A DIVERSE WORKPLACE This year, a new set of items was placed on the survey to capture some key skills employers consider appropriate for participation in a diverse workplace. Overall, the majority of entering students tended to rate themselves reasonably high on many of the items, with multiracial students rating themselves higher than other racial or ethnic groups. In contrast, American Indians tended to rate themselves less highly than other groups. All groups tend to rate themselves lower on a cognitive development item, “openness to having my own views challenged,” while fewer Asian Americans tend to rate themselves highly on the “ability to discuss and negotiate controversial issues.” By far, the biggest difference between men (69.4 percent) and women (58.5 percent) also occurs on this item. Students appear to have the most confidence in their tolerance of others with different beliefs and their ability to work cooperatively with diverse people. This may be a function of more diversity in the schools. Although 58.8 percent of all freshmen came from mostly White or all White high schools, slight increases were evident in those who came from mostly non-White (13.0 percent) and nearly a quarter (24.8 percent) came from roughly half non-White high schools. A continued decline in the percentage of White students among college freshmen was also evident this year: 71.9 percent of freshmen identified as White in 2008, compared with 81.8 percent of freshmen twenty years ago. Skills for a Diverse Workplace, by Race/Ethnicity (percentages) Reporting “Above Average” or “T op 10%” Ability to see the world from someone else’s perspective Tolerance of others with different beliefs Openness to having my own views challenged Ability to discuss and negotiate controversial issues Ability to work cooperatively with diverse people Note: PI = Pacific Islander White African American American Indian Asian/PI American Latina/o 64.0 72.6 56.3 62.8 77.3 62.2 67.5 61.4 64.8 80.5 58.5 60.9 51.6 52.3 66.8 69.7 77.9 62.6 59.3 79.8 66.4 74.1 61.2 61.5 80.4 Multi-Racial American 72.9 79.6 64.0 71.1 84.9 MORE STUDENTS REPORTING LEARNING DISABILITIES Among the incoming 2008 freshmen, 3.3 percent report that they have a learning disability. This figure has steadily and slowly increased since the question was first asked in 1983, when only 0.5 percent reported that they had a learning disability. Trends in Students Reporting a Learning Disability 5.0 Learning Disability % of Students 4.0 3.0 2.0 1.0 0.0 1983 1985 1987 1991 1994 1998 2002 2008 Students with self-reported learning disabilities are more likely to anticipate that they will need extra time to complete their bachelor’s degree and use campus counseling and tutoring services than freshmen overall. Specifically, incoming first-year students reporting a learning disability are more likely to expect that they will need extra time to complete their bachelor’s degree (11.6 vs. 6.4 percent), more likely to anticipate that they will seek personal counseling (15.0 vs. 9.2 percent), and more likely to expect that they will need tutoring for specific courses (43.5 vs. 31.6 percent). The 2008 monograph also highlights the increasing trend for student support of “green” initiatives, particularly among women; frequencies of internet usage and purposes (i.e., research, blogging, reading news sites); a continued decrease in student drinking behavior; and a rise in the importance of developing a meaningful philosophy of life. The data reported in this monograph are weighted to provide a normative profile of the American freshman population for use by individuals engaged in policy analysis, educational research, college administration, human resource planning and guidance and counseling. The data are also useful to the general community of current and future college students, their parents, and college faculty. The full report provides data separately for men and women, and for 26 different institutional groupings. Please contact the Higher Education Research Institute for more information or to order your copy of the 2008 Freshman National Norms monograph. Source: Pryor, J.H., Hurtado, S., DeAngelo, L., Sharkness, J., Romero, L.C., Korn, W.S., & Tran, S. (2008). The American freshman: National norms for fall 2008. Los Angeles: Higher Education Research Institute, UCLA. higher education research institute Research Directors Sylvia Hurtado, HERI Director John H. Pryor, CIRP Director Linda DeAngelo, CIRP Assistant Director for Research Serge Tran, Associate Director for Data Management/Analysis Jennifer Lindholm, Spirituality in Higher Ed, Project Director Melissa C. Aragon, Special Projects Manager Affiliated Scholars Walter R. Allen, Allan Murray Cartter Professor of Higher Education Alexander W. Astin, Founding Director and Senior Scholar Helen S. Astin, Senior Scholar Mitchell J. Chang, Professor Patricia M. McDonough, Professor José Luis Santos, Assistant Professor Linda J. Sax, Associate Professor Rick Wagoner, Assistant Professor Victor B. Sáenz, Assistant Professor, University of Texas at Austin

