Cultural eutrophication in the Greater North Sea Cause, symptoms, mitigation
advertisement
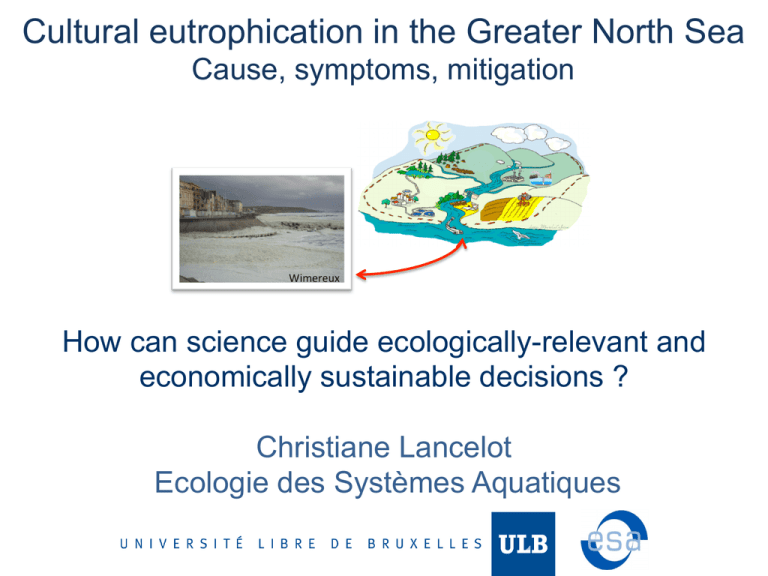
Cultural eutrophication in the Greater North Sea Cause, symptoms, mitigation How can science guide ecologically-relevant and economically sustainable decisions ? Christiane Lancelot Ecologie des Systèmes Aquatiques CONTENT I-The Global Eutrophication Context II-Eutrophication in the Greater North Sea III-Science Support to Combat Eutrophication I-The Global Eutrophication Context ü Global trends in nutrient loads ü Mechanisms behind eutrophication ü Undesirable effects Global Nutrient Loads Since 1950: the Great Acceleration: a connected global system population * socio-economy * green revolution Syvitski, 2012 As a consequence: Global increase of N (18%), P (13%) river inputs Global retention (18%) of Si Seitzinger et al. 2010 Beusen et al., 2009 Exacerbated by release from growing aquaculture, atmospheric and groundwater inputs Cultural Eutrophication Modification of the natural N:P:Si balance of coastal waters towards N and P excess èprimary production ì Undesirable if this nutrient excess appreciably degrades ecosystem health and/or the provision of goods and services MSD-TG5 report 2010; Fereira et al. 2011 DESIRABLE Interannual variations Nutrient loads Total N, P: ì Si: ≈ or î Change in coastal N:P:Si nutrient status UNDESIRABLE HABs (high-biomass, toxic…) Hypoxia/anoxia Benthic/pelagic species shifts … Different symptoms ! The functioning of Marine Ecosystems Marine Ecosystem: Generic Process Irradiance Marine Foodweb Linear food chain Nutrient inputs (upwelling, rivers, atmosphere DA Nitrogen Phosphorus Silicium Microbial network Poissons NS Phytoplankton 2000 Pristine N:Si:P=16:16:1 phytoplankton pattern Dominated by DA Zooplankton Biomass 1500 1000 DA# NS# 500 0 0 60 120 180 days 240 300 360 Cultural eutrophication: Generic Process Irradiance Marine Foodweb Linear food chain Nutrient inputs (upwelling, rivers, atmosphere) DA Nitrogen Phosphorus Silicium Poissons Microbial network ì NS Phytoplankton 2000 Zooplankton Biomass 2000 1500 Eutrophied phytoplankton pattern Biomass Pristine 1500 DA# 1000 NS# 1000 DA# NS# 500 500 0 0 0 60 120 180 days 240 300 360 0 60 120 180 days 240 300 360 Undesirable symptoms of eutrophication: HABs Foam deposits Fish mortality Algal deposit & H2S release Shellfish poisening High-biomass HABs Toxic HABS Karenia mikimotoï Pseudo-Nitzschia Phaeocystis globosa Ulva Dinophysis II-Eutrophication in the Greater North Sea North Sea Ems Elbe OSPAR regions Thames English Channel Southern Bight Rhine/Meuse Scheldt Somme Seine ü Historical key dates ü Nutrient sources today ü Eutrophication symptoms Eutrophication in the greater North Sea: key dates ü 1950-1970 Great Acceleration Nutrient river load e.g. River Scheldt 40 35 Kt Si y-1 Pristine 30 ü After 1970 Eutrophication symptoms Environmental awareness ü 1975-1991 Governance (OSPAR, HELCOM) Combination of professional judgment and political art :e.g. 50% î1985 N and P loads First EU Directives (WWT, Nitrate) ü Since 2000 (WFD and MSD) Awareness of the ‘land-sea’ connectivity, regime shifts, thresholds, points of nonreturn è Ecological Quality Objectives. Sustainable coastal sea. 25 20 15 10 5 0 1940 1950 1960 1970 1980 1990 2000 2010 1960 1970 1980 1990 2000 2010 1970 1980 1990 2000 2010 60 50 Kt N y-1 40 30 20 10 0 1940 Pristine 1950 6 5 Kt P y-1 4 3 2 1 0 1940 Pristine 1950 1960 Model reconstruction after Lancelot et al., 2007; Passy et al., 2013 Eutrophication in the greater North Sea: current status Ocean color 2011 Nutrient enrichment Winter nitrate concentration Thames Scheldt Elbe Ems Rhine/Meuse Thames Lancelot et al., 2014 Scheldt Atmospheric deposition fraction total N Somme Seine Thames Scheldt MarCoast Same causes but distinct blooms 0.3 0.2 0.1 0 Troost et al., 2013 III-Science Support to Combat Eutrophication What can be done to improve the situation and how can we appraise mitigation actions ? ü Integrated Impact Assessment Pathway/toolkit ü Case study: Phaeocystis blooms Impact Assessment Pathway:integration of coupled biogeochemical models in a DPSIR loop Drivers SENEQUE-Riverstrahler Model RS-MIRO&CO-CO2 model 7-.&'&'()?.*$5+-$#)3"#$%+).'#)/".+*.%)D"'$)3"#$%+)) =.*$5)>;.%&*0)&')*-$) #5.&'.($)'$*?"5@) !"#$%&'()(*"&+,-$.&/0& /1$&.$2& -CO2 (1) SENEQUE-GIS Si, N, P emissions Point & diffuse (2) RIVERSTRAHLER State Hydro-climatic constraints Si, N, P export Landuse and agric. practices Phaeocystis blooms (3) MIRO N:P:Si imbalance Phaeocystis foam Response N, P reduction measures Urban point sources Impact RIVE A$5$+$'*.1"')"B)$/"%"(&/.%).'#) 2&"($"/-$3&/.%)C5"/$++$+)&').>;.1/) +0+*$3+) ))))) ) Pressure )) Drainage network morphology Integrated modeling approach WWTP agriculture ecological effectiveness Lancelot et al., 2011 (1) Ruelland et al. 2007; (2) Billen and Garnier 1999; (3) Lancelot et al., 2005 Some possible scenarios 33 d Quality criteria Phaeocystis maximum cells, 106 L-1 50 25 bloom duration River Nitrates, mgN/l < 0.5 0.5 -­‐ 2.5 2.5 -­‐ 6 > 6 Seq-Eau ♯d 0 Lancelot et al., 2009 28 d27 d 28 d WWT>20000 GAP WWT upgrading + Garnier et al., 2012 + 16 d Overall conclusion and futuring The fact Human activity is modifying the quantity and quality of nutrients (N, P, Si) delivered to the coastal sea; This N & P enrichment has boosted non-diatom species often undesirable/harmful; Most attempts to reducing N & P loads have not decrease coastal problems because of end-of-pipe solution choice rather than acting on the NUE (nutrient use efficiency) process. Towards solutions: de-eutrophication toolkit ü Interlinked suite of ecological and socio-economic models ü Scenario-driven approach: dialogue between science and society Drivers Integrated modeling approach WWTP agriculture Pressure Si, N, P emissions Point & diffuse WATERSHED Direct cost assessment RIVER State Si, N, P export Blooms Impact Si:N:P costal imbalance HABs Ecosystem disturbance MARINE SYSTEM Ecological & economic(CV) effectiveness Response N, P reduction measures CBA Risk Ana Acknowledgements EU FP6 Thresholds of Environmental sustainability IAP TIMOTHY (Tracing and Integrated Modeling of Natural and Anthropogenic Effects on Hydrosystems (TIMOTHY) Case study:The Scheldt River Basin and Adjacent Coastal North Sea AMORE (Advanced Modelling and Research on Eutrophication) ! EU FP7 AWARE Adaptative management: Increased connectivity between politic, science, public Ecosystem Models as Support to Eutrophication Management In the North Atlantic Ocean Cited references Beusen, A.H.W., Bouwmann, A.F., Durr, H.H., Dekkers, A.L.M., Hartmann, J. Global patterns of dissolved silica export to the coastal zone: results from a spatially explicit global model. Global Biogeochem. Cycles, 23:GB0A02, doi: 10.1029/2008GB003281 (2009) Billen, G., Garnier, J.,1999. Nitrogen transfers through the Seine drainage network: a budget based on the application of the Riverstrahler model. Hydrobiol. 410, 139-150 Ferreira JG, Andersen JH, Borja A, et al. (2011) Overview of eutrophication indicators to assess environmental status within the European Marine Strategy Framework Directive RID C-5701-2011. Estuar Coast Shelf Sci 93:117–131. doi: 10.1016/ j.ecss.2011.03.014. Garnier J, Passy P, Rousseau V, Gypens N, CallensJ, Silvestre M, Billen J, Lancelot C. 2012. The diseased southern North Sea: current status and possible solutions. In: Sustainable Water Ecosystems Management in Europe. Bridging the knowledge of citizens, scientists and policy-makers. Ed C. Sessa. EU report series, IWA Publishing, London, NY. Lancelot C., Spitz, Y., Gypens, N., Ruddick, K., Becquevort, S., Rousseau, V., Lacroix, G., Billen, G., 2005. Modelling diatom and Phaeocystis blooms and nutrient cycles in the Southern Bight of the North Sea: the MIRO model. Mar. Ecol. Progr. Ser. 289, 63-78. Lancelot, C., Gypens, N., Billen, G., Garnier, J., Roubeix, V., 2007. Testing an integrated river-ocean mathematical tool for linking marine eutrophication to land use: the Phaeocystis-dominated Belgian coastal zone (Southern North Sea) over the past 50 years. J. Mar. Sys. 64, 216–228. Lancelot, C., Rousseau, V., Gypens, N., 2009. Ecologically based indicators for Phaeocystis disturbance in eutrophied Belgian coastal waters (Southern North Sea) based on field observations and ecological modelling. J. Sea Res. 61, 44-49. Lancelot, C., Thieu, V., Polard, A., Garnier, J., Billen, G., Hecq, W., Gypens, N., 2011. Cost assessment and ecological effectiveness of nutrient reduction options for mitigating Phaeocystis colony blooms in the Southern North Sea: An integrated modeling approach. Sci. Total Environ. 409, 2179–2191. Lancelo C, Passyy P, Gypens N. 2014. Model assessment of present-day Phaeocystis colony blooms in the Southern Bight of the North Sea (SBNS) by comparison with a reconstructed pristine situation. Harmful Algae 37:172-182. Passy, P., Gypens, N., Billen, G., Garnier, J., Lancelot, C., Thieu, V., Rousseau, V., Callens, J., 2013. A Model reconstruction of riverine nutrient fluxes and eutrophication in the Belgian Coastal Zone since 1984, 2013. J. Mar. Syst. 128, 106-122. Ruelland, D., Billen, G., Brunstein, D., Garnier, J., 2007. SENEQUE 3: a GIS interface to the RIVERSTRAHLER model of the biogeochemical functioning of river systems. Sci. Tot. Environ. 375, 257-273. Seitzinger, S.P. et al. Global river nutrient export: a scenario analysis of past and future trends. Global Biogeochem. Cycles, 24: GB0A08, doi:10.1029/2009GB003587 (2010). Sivystski, J. 2012. Anthropocene: an epoch of our making. Global Change issue 78. Troost, TA, Blaas M, LOS FJ. 2013. The role of atmospheric deposition in the eutrophication of the North Sea: a model analysis. J. Mar. Sys. 125: 101-112
