Tennessee Higher Education Commission 2010-15 Performance Funding Summary of Points Recommended
advertisement
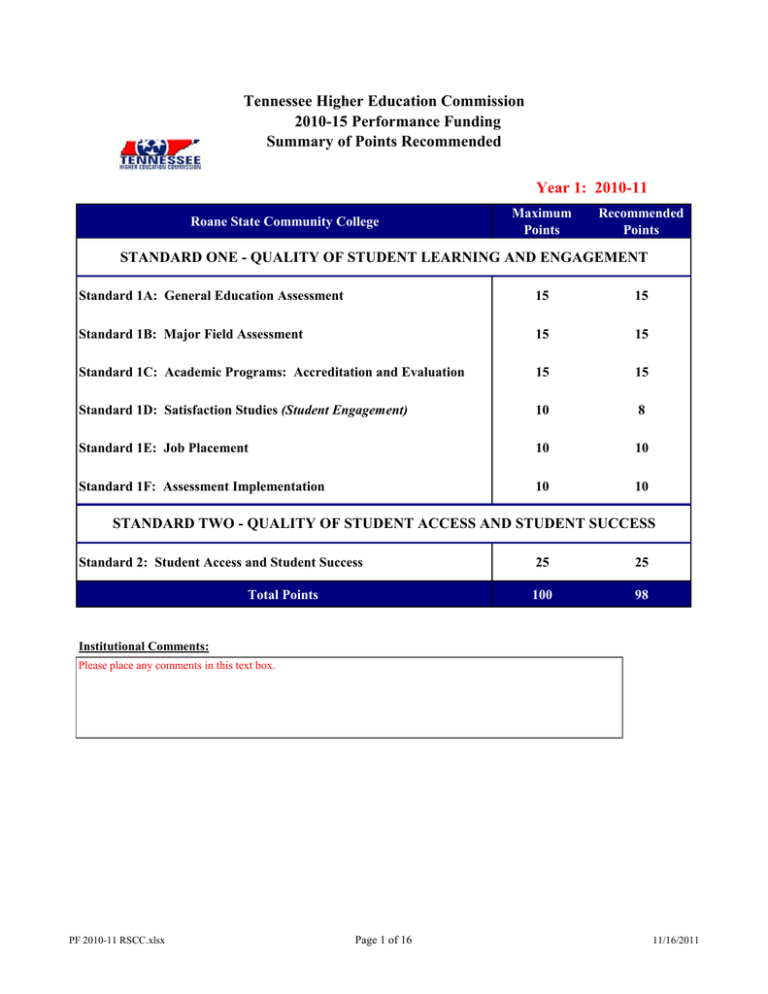
Tennessee Higher Education Commission 2010-15 Performance Funding Summary of Points Recommended Year 1: 2010-11 Roane State Community College Maximum Points Recommended Points STANDARD ONE - QUALITY OF STUDENT LEARNING AND ENGAGEMENT Standard 1A: General Education Assessment 15 15 Standard 1B: Major Field Assessment 15 15 Standard 1C: Academic Programs: Accreditation and Evaluation 15 15 Standard 1D: Satisfaction Studies (Student Engagement) 10 8 Standard 1E: Job Placement 10 10 Standard 1F: Assessment Implementation 10 10 STANDARD TWO - QUALITY OF STUDENT ACCESS AND STUDENT SUCCESS Standard 2: Student Access and Student Success Total Points 25 25 100 98 Institutional Comments: Please place any comments in this text box. PF 2010-11 RSCC.xlsx Page 1 of 16 11/16/2011 Tennessee Higher Education Commission 2010-15 Performance Funding Standard 1A: General Education Assessment The General Education standard is designed to provide incentives to institutions for improvements in the quality of their undergraduate general education program as measured by the performance of graduates on an approved standardized test of general education. Roane State Community College Year 1: 2010-11 Maximum Points: Recommended Points: Test Type: 15 15 ETS Proficiency Profile Graduates Tested: All or Sample? All Total Eligible Graduates: 773 No. Graduates Tested: 780 Percent Tested: 101% National Norm Comparison (Maximum 15 points in Years 1-3 and 10 points in Years 4-5) Mean Score Institution National Diff (I-Nat'l) % Institution to National Average Mean Score Institution 3 Yr Average Diff (I-Avg) % Institution to National Average 2010-11 441.7 437.5 4.1 2011-12 2012-13 2013-14 2014-15 0.0 0.0 0.0 0.0 100% 0% 0% 0% 0% Institutional Trends Comparison (Maximum 5 points in Years 4-5) 2013-14 2014-15 0.0 0.0 0% 0% Institutional Comments: Tennessee Higher Education Commission Page 2 of 16 11/16/2011 Tennessee Higher Education Commission 2010-15 Performance Funding Standard 1B: Major Field Assessment The Major Field standard is designed to provide incentives for institutions to improve the quality of academic programs as evaluated by the performance of graduates on approved examinations. Roane State Community College Year 1: 2010-11 Maximum Points: 15 Recommended Points: 15 Licensure Programs Reported Annually (Sorted by CIP Code) 2000 CIP Academic Program Degree Test Year Test Type No. Grads No. Tested No. Passed % Tested Inst. Score Comp. Score % Inst to Comparison Score 1 31.51.0602.00 DENTAL HYGIENE TECHNOLOGY 2.3.AAS 2011 NBDHE 12 12 10 100% 83% 96% 87% 2 31.51.0803.00 OCCUPATIONAL THERAPY ASST 2.3.AAS 2010 OTRE 20 20 20 100% 100% 84% 100% 3 31.51.0806.00 PHYSICAL THERAPY ASSISTANT 2.3.AAS 2010 NPTE 19 19 18 100% 95% 84% 100% 27 94% 87% 92% 95% 4 31.51.0907.00 RADIOLOGIC TECHNOLOGY 2.3.AAS 2010 ASRT 33 31 5 31.51.0908.00 RESPIRATORY THERAPY 2.3.AAS 2010-11 NBRCE 11 11 11 100% 100% 77% 100% 6 31.51.1601.00 NURSING 2.3.AAS 2010 NCLEX 99 99 95 100% 96% 82% 100% 7 31.51.1801.00 OPTICIANRY 2.3.AAS 2010-11 NOCE 21 21 18 100% 86% 53% 100% % Tested Inst. Score Comp. Score % Inst to Comparison Score Programs Reported Once During 5 Year Cycle (Sorted by Reporting Year) 2000 CIP Academic Program Degree Test Year Test Code No. Grads No. Tested 1 32.52.0201.01 BUSINESS MANAGEMENT TECH 2.3.AAS 2010-11 Local 32 31 97% 74.61 70 100% 2 32.52.0299.01 CONTEMPORARY MANAGEMENT 2.3.AAS 2010-11 Local 27 24 89% 65.79 70 94% 3 31.51.0707.00 MEDICAL RECORDS TECHNOLOGY 2.3.AAS 2011-12 RHIT 4 27.43.0107.00 CRIMINAL JUSTICE 2.3.AAS 2012-13 Local 5 14.22.0302.00 LEGAL ASSISTING 2.3.AAS 2013-14 Local 6 08.13.0101.00 TEACHING 2.3.AST 2014-15 TBD 98% 16.32 16.19 101% Programs Exempt During 5 Year Cycle (Sorted by Exemption) 2000 CIP Academic Program Degree Exemption 1 06.11.0801.00 WEB TECHNOLOGY (RODP) 2.3.AAS Low Producing 2 12.19.0706.00 EARLY CHILDHOOD EDUCATION 2.3.AAS Low Producing 3 16.24.0102.02 PROFESSIONAL STUDIES 2.3.AAS Low Producing 4 28.45.0702.00 GEOGRAPHIC INFORMATION SYSTEMS 2.3.AAS Low Producing 5 31.51.2202.00 ENVIRONMENTAL HEALTH TECH 2.3.AAS Low Producing 6 13.21.0101.01 GENERAL TECHNOLOGY 2.3.AAS Multidisciplinary 7 16.24.0101.01 GENERAL EDUCATION 2.3.AA, AS Multidisciplinary 8 31.51.9999.01 ALLIED HEALTH SCIENCES 2.3AAS New 274 268 Institutional Comments: Opticianry: Two additional students have taken the National Opticianry Competency Exam. Their scores will be submitted to THEC when they are received by RSCC. The national pass rate was 53% in May, 2010. (Note: The Performance Funding report for 2009-10 inaccurately stated the national pass rate for this exam as 94%.) Score reports received October 27 2011) Business Management Technology: One student was granted approval for an exemption. Contemporary Management: Two students were granted approval for exemptions. One additional student previously took the test in 2007. Tennessee Higher Education Commission Page 3 of 16 11/16/2011 Tennessee Higher Education Commission 2010-15 Performance Funding Standard 1B: Major Field Assessment Year 1: 2010-11 Roane State Community College Academic Program Test Code Test Type BUSINESS MANAGEMENT TECH Local Other CONTEMPORARY MANAGEMENT Local Other Previous Mean 70 70 2010-11 Average % Inst to Comparison Score No. Student Scores 74.6 100.0% 31 65.8 94.0% 24 BUSINESS MANAGEMENT TECH CONTEMPORARY MANAGEMENT 73.0 81.0 76.0 71.0 55.0 71.0 78.0 66.0 71.0 74.0 80.0 70.0 73.0 81.0 77.0 73 0 73.0 71.0 78.0 70.0 85.0 74.0 90.0 93.0 61.0 69.0 68.0 78.0 63.0 78.0 89.0 76.0 65.0 71.0 51.0 53.0 71.0 74.0 63.0 61.0 58.0 70.0 69.0 64.0 55.0 59.0 69.0 66 0 66.0 74.0 76.0 65.0 72.0 53.0 71.0 68.0 81.0 Student Scores 1 2 3 4 5 6 7 8 9 10 11 12 13 14 15 16 17 18 19 20 21 22 23 24 25 26 27 28 29 30 31 32 33 34 35 36 37 38 39 40 41 42 43 44 45 Tennessee Higher Education Commission Page 4 of 16 11/16/2011 Tennessee Higher Education Commission 2010-15 Performance Funding Standard 1C: Academic Programs: Accreditation and Evaluation The Academic Programs standard is designed to provide incentives for institutions to achieve and maintain program excellence and accreditation. Year 1: 2010-11 Roane State Community College Maximum Points Recommended Points Accreditation Number of Accreditable Programs: Number of Programs Seeking Accreditation Number of Accredited Programs: Percent Accredited: Points Recommended: Undergraduate Programs Number of Non-Accreditable Programs: Points Recommended: 15 15 11 10 16 1 15 100% 5 Accreditation Accreditation Cycle 2000 CIP Academic Program Degree Level Accrediting Agency Accredited? Begin Date End Date Next Site Visit 1 14.22.0302.00 LEGAL ASSISTING 2.3.AAS ABA Yes 2005 2012 2012 2 31.51.0602.00 DENTAL HYGIENE TECH 2.3.AAS ADA Yes 2007 2013 2013 3 31.51.0707.00 MEDICAL RECORDS TECH 2.3.AAS CAHIIM Yes 2005 On-going -- 4 31.51.0803.00 OCCUPATIONAL THERAPY ASST. 2.3.AAS AOTA Yes 2007 2014 2014 5 31.51.0805.00 PHARMACY TECHNICIAN 2.2C1 ASHEP Yes 2009 2015 2015 APTA Yes 2010 2020 2019 CAAHEP Yes 2006 2011 Sep-11 2.3.AAS JCERT Yes 2006 2014 2014 2.3.AAS CAAHEP Yes 2001 2011 Jun-11 6 31.51.0806.00 PHYSICAL THERAPY ASSISTANT 2.3.AAS 7 31.51.0904.00 EMT/PARAMEDIC 2.2.C1 8 31.51.0907.00 RADIOLOGIC TECHNOLOGY 9 31.51.0908.00 RESPIRATORY THERAPY 10 31.51.1099.01 POLYSOMNOGRAPHY TECH 2.1.C1 CAAHEP Yes 2010 2014 2014 11 31.51.1601.00 NURSING 2.3.AAS NLNAC Yes 2007 2015 2015 12 31.51.1801.00 OPTICIANRY 2.3.AAS COA Yes 2008 2014 2014 13 31.51.3501.00 SOMATIC THERAPY 2.1.C1 COMTA Yes 2010 2015 2015 14 32.52.0201.01 BUSINESS MANAGEMENT TECH 2.3.AAS ACBSP Yes 2004 2014 2014 15 32.52.0299.01 CONTEMPORARY MANAGEMENT 2.3.AAS ACBSP Yes 2004 2014 2014 16 12.19.0706.00 EARLY CHILDHOOD EDUCATION 2.3.AAS NAEYC Tennessee Higher Education Commission Page 5 of 16 NAECYC decision in 2014-15 11/16/2011 2010-15 Performance Funding Standard 1C: Academic Programs: Accreditation and Evaluation The Academic Programs standard is designed to provide incentives for institutions to achieve and maintain program excellence and accreditation. Year 1: 2010-11 Roane State Community College Maximum Points Recommended Points Undergraduate Programs Number of Non-Accreditable Programs: Points Recommended: 15 15 Accreditation Number of Accreditable Programs: Number of Programs Seeking Accreditation Number of Accredited Programs: Percent Accredited: Points Recommended: 11 10 16 1 15 100% 5 Program Evaluation: Non-Accreditable Programs RSCC - 5 Year Review Cycle 2000 CIP Academic Program Degree Year Reviewed Evaluation Type * Total No. Standards 23 1 31.51.2202.00 ENVIRONMENTAL HEALTH TECH 2.3.AAS 2010-11 AA 2 16.24.0101.01 GENERAL EDUCATION 2.3.AA, AS 2011-12 AA 3 06.11.0801.00 WEB TECHNOLOGY (RODP) 2.3.AAS 2011-12 AA 06.11.0801.00 WEB PAGE AUTHORING (RODP) 2.1.C1 28.45.0702.00 GEOGRAPHIC INFO SYSTEMS 2.3.AAS 4 "NA" Standards # Stand. Met 23 Embedded Certificate 2011-12 AA 28.45.0702.00 GEOGRAPHIC INFO SYSTEMS 2.1.C1 5 06.110101.00 COMPUTER SCIENCE 2.1.C1 2014-15 AA 6 08.13.0101.00 TEACHING 2.3.AST 2014-15 AA Embedded Certificate 7 13.21.0101.01 GENERAL TECHNOLOGY 2.3.AAS 2013-14 PR 8 16.24.0102.02 PROFESSIONAL STUDIES 2.3.AAS 2013-14 AA 9 27.43.0107.00 CRIMINAL JUSTICE (AAS) 2.3 AAS 2012-13 PR 27.43.9999.00 HOMELAND SECURITY 2.1.C1 10 31.51.0708.00 MEDICAL TRANSCRIPTION 2.1.C1 2013-14 PR 11 31.51.9999.01 ALLIED HEALTH SCIENCES 2.3AAS 2013-14 AA Embedded Certificate 23 0 23 *PR denotes traditional Program Review with checklist of 25 criteria. Criterions include program outcomes, curriculum, teaching/learning environment, faculty and support. AA denotes Academic Audit with checklist of 20 criteria or 23 criteria for programs undergoing the Academic Audit a second time or more. Criterions include learning objectives, curriculum/co-curriculum, teaching/learning processes, student learning assessment, quality assurance, overall assessment, and support. Institutional Comments: Medical Records Technology: A continuation of accreditation letter from CAHIM is attached. Physical Therapy Assistant: The American Physical Therapy Association voted to continue the program's accreditation on April 19, 2011 (effective through 2020). Documentation is attached. EMT/Paramedic: A self-study was submitted to CoAEMSP on April 14, 2011. A site visit was requested for September, 2011. Respiratory Therapy: A self-study was submitted to the Commission on Accreditation for Respiratory Care in February, 2011. A site visit occurred June 27-28, 2011. Somatic Therapy: The program was reaffirmed by the Commission on Massage Therapy in April, 2010 (effective through 2015). Documentation is attached. Environmental Health Technology: An academic audit of this program was conducted in April, 2011. All 23 (100%) standards were met. Documentation is attached. Early Childhood Education: The appointment of a new director will be effective July 30, 2011. An application for accreditation will be submitted to NAECYC by the end of fall, 2011. Tennessee Higher Education Commission Page 6 of 16 11/16/2011 2010-15 Performance Funding Standard 1C: Academic Programs: Accreditation and Evaluation The Academic Programs standard is designed to provide incentives for institutions to achieve and maintain program excellence and accreditation. Year 1: 2010-11 Roane State Community College Maximum Points Recommended Points Accreditation Number of Accreditable Programs: Number of Programs Seeking Accreditation Number of Accredited Programs: Percent Accredited: Points Recommended: Tennessee Higher Education Commission Undergraduate Programs Number of Non-Accreditable Programs: Points Recommended: 15 15 11 10 16 1 15 100% 5 Page 7 of 16 11/16/2011 Tennessee Higher Education Commission Page 8 of 16 11/16/2011 % Met 100% 100% Tennessee Higher Education Commission Page 9 of 16 11/16/2011 Tennessee Higher Education Commission Page 10 of 16 11/16/2011 Tennessee Higher Education Commission 2010-15 Performance Funding Standard 1D: Satisfaction Studies (Student Engagement) The Satisfaction Studies standard is designed to provide incentives for institutions to improve the quality of their undergraduate programs as evaluated by surveys of undergraduate students, recent graduates, and regional and/or national employers of recent graduates. Highlighted items were noted as successful due to a variance of <.02. Roane State Community College Year 1: 2010-11 Maximum Points: 10 Successful Questions: Requested Points: 42 8 Satisfaction Study Year 2010-11 Student Engagement Survey (NSSE and CCSSE) 2011-12 Alumni Satisfaction Project 2012-13 Employer Satisfaction Project 2013-14 Student Engagement Survey (NSSE and CCSSE) 2014-15 Comprehensive Satisfaction Project RSCC 2011 Mean Peer Colleges 2011 Mean Above/Below Mean Points Awarded for Meeting 2011 Peers RSCC 2009 Mean Points Awarded 1 2.92 0.5 1 2 24 2.24 0.0 0.0 ACTIVE AND COLLABORATIVE LEARNING 4a. Asked questions in class or contributed to class discussions 4b. Made a class presentation 4f. Worked with other students in projects during class 4g. Worked with classmates outside of class to prepare class assignments 4h. Tutored or taught other students (paid or voluntary) 4i. Participated in a community-based project as a part of a regular course 4r. Discussed ideas from your readings or classes with others outside of class (students, family members, co-workers, etc.) 2.98 2.07 2.93 2.06 2.43 2.5 1 2.45 2.02 1.89 1 2.10 0.0 0.0 1.37 1.38 1 1.40 1.22 1.31 1 1.32 0.0 2.64 2.57 1 2.74 0.0 Total Points for Active and Collaborative Learning 7 0.5 STUDENT EFFORT 4c. Prepared two or more drafts of a paper or assignment before turning it in 4d. Worked on a paper or project that required integrating ideas or information from various sources 2.63 2.50 1 2.45 0.5 2.77 2.76 1 2.77 0.0 0.0 4e. Came to class without completing readings or assignments 6b. Number of books read on your own (not assigned) for personal enjoyment or academic enrichment 10a. Preparing for class (studying, reading, writing, rehearsing, doing homework, or other activities related to your program) 1.80 1.80 1 1.79 2.10 2.10 1 2.10 0.0 2.19 1.99 1 2.16 0.0 13d1. Frequency: Peer or other tutoring 1.52 1.48 1 1.40 0.5 1 1.61 0.0 1 8 2.33 0.0 1.0 13e1. Frequency: Skill labs (writing, math, etc.) 13h1. Frequency: Computer lab Total Point for Student Effort Tennessee Higher Education Commission 1.64 2.36 1.72 2.09 Page 11 of 16 11/16/2011 RSCC 2011 Mean Peer Colleges 2011 Mean Above/Below Mean Points Awarded for Meeting 2011 Peers RSCC 2009 Mean Points Awarded ACADEMIC CHALLENGE 4p. Worked harder than you thought you could to meet an instructor's standards or expectations 2.75 2.59 1 2.68 0.5 5b. Analyzing the basic elements of an idea, experience, or theory 5c. Synthesizing and organizing ideas, information or experiences in new ways 5d. Making judgments about the value or soundness of information, arguments, or methods 5e. Applying theories or concepts to practical problems or in new situations 2.94 2.89 1 2.98 0.0 2.80 2.76 1 2.84 0.0 2.68 2.58 1 2.69 0.0 2.71 2.69 1 2.82 0.0 5f. Using information you have read or heard to perform a new skill 6a. Number of assigned textbooks, manuals, books, or book-length packs of course readings 2.79 2.80 1 2.91 0.0 2.97 2.89 1 2.94 0.0 6c. Number of written papers or reports of any length 7. Mark the box that best represents the extent to which your examinations during the current school year have challenged you to do your best work at this college 2.93 2.87 1 2.86 0.5 5.32 5.01 1 5.45 0.0 9a. Encouraging you to spend significant amount of time studying Total Points for Academic Challenge 3.12 3.01 1 10 3.13 0.0 1.0 STUDENT-FACULTY INTERACTION 4k. Used email to communicate with an instructor 2.95 2.75 1 2.83 0.5 4l. Discussed grades or assignments with an instructor 2.68 2.57 1 2.64 0.0 4m. Talked about career plans with an instructor or advisor 4n. Discussed ideas from your readings or classes with instructors outside of class 4o. Received prompt feedback (written or oral) from instructors on your performance 2.02 2.06 1 2.10 0.0 1.79 1.75 1 1.81 0.0 2.82 2.68 1 2.86 0.0 4q. Worked with instructors on activities other than coursework Total Points for Student-Faculty Interaction 1.37 1.42 1 6 1.40 0.0 0.5 SUPPORT FOR LEARNERS 9b. Providing the support you need to help you succeed at this college 9c. Encouraging contact among students from different economic, social, and racial or ethnic backgrounds 9d. Helping you cope with your non-academic responsibilities (work, family, etc.) 2.99 2.99 1 3.01 0.0 2.41 2.53 1 2.33 0.5 1.86 1.95 1 1.89 0.0 9e. Providing the support you need to thrive socially 2.10 2.16 1 2.09 0.0 9f. Providing the financial support you need to afford your education 2.56 2.55 1 2.37 0.5 13a1. Frequency: Academic advising/planning 1.66 1.78 1 1.62 0.0 13b1. Frequency: Career Counseling Total Points for Support for Learners 1.33 1.43 1 7 38 1.33 0.0 1.0 4.0 Points Awarded Tennessee Higher Education Commission Page 12 of 16 11/16/2011 Tennessee Higher Education Commission 2010-15 Performance Funding Standard 1E: Job Placement The Job Placement standard is designed to provide incentives for community colleges to continue to improve job placement of their career program graduates. Roane State Community College Total Number Programs: Total Placeable Total Placed Placement Rate 2000 CIP Academic Program Year 1: 2010-11 28 440 427 97% Degree Maximum Points: Recommended Points 2010 NonRespondents EXEMPTIONS Grads Adjustment Grads Educ Medical Family Military 10 10 Total Placeable Total Placed Volunteer Percent Placed 1 06.11.0801.00 WEB TECHNOLOGY (RODP) 2.3.AAS 0 0 0 0 n/a 2 06.11.0801.00 WEB PAGE AUTHORING (RODP) 2.1.C1 0 0 0 0 n/a 3 06.110101.00 COMPUTER SCIENCE 2.1.C1 1 1 4 12.19.0706.00 EARLY CHILDHOOD EDUCATION 2.3.AAS 11 11 1 5 13.21.0101.01 GENERAL TECHNOLOGY 2.3.AAS 56 53 11 6 14.22.0302.00 LEGAL ASSISTING 2.3.AAS 7 7 3 7 27.43.0107.00 CRIMINAL JUSTICE 2.3 AAS 20 17 10 8 27.43.9999.00 HOMELAND SECURITY 2.1.C1 3 3 9 28.45.0702.00 GEOGRAPHIC INFO SYSTEMS 2.3.AAS 8 10 28.45.0702.00 GEOGRAPHIC INFO SYSTEMS 2.1.C1 11 31.51.0602.00 DENTAL HYGIENE TECHNOLOGY 2.3.AAS 12 31.51.0707.00 MEDICAL RECORDS TECHNOLOGY 2.3.AAS 7 7 13 31.51.0708.00 MEDICAL TRANSCRIPTION 2.1.C1 11 11 14 31.51.0803.00 OCCUPATIONAL THERAPY ASST. 2.3.AAS 20 20 15 31.51.0805.00 PHARMACY TECHNICIAN 2.2C1 14 16 31.51.0806.00 PHYSICAL THERAPY ASSISTANT 2.3.AAS 19 17 31.51.0904.00 EMT/PARAMEDIC 2.2.C1 36 36 18 31.51.0907.00 RADIOLOGIC TECHNOLOGY 2.3.AAS 33 33 19 31.51.0908.00 RESPIRATORY THERAPY 2.3.AAS 11 1 20 31.51.0999.01 DIAGNOSIS & PROCEDURAL CODING 2.2.C1 9 1 21 31.51.1099.01 POLYSOMNOGRAPHY TECH 2.1.C1 15 15 22 31.51.1601.00 NURSING 2.3.AAS 99 99 23 31.51.1801.00 OPTICIANRY 2.3.AAS 22 24 31.51.2202.00 ENVIRONMENTAL HEALTH TECH 2.3.AAS 2 25 31.51.3501.00 SOMATIC THERAPY 2.1.C1 10 26 31.51.9999.01 ALLIED HEALTH SCIENCES 2.3AAS 4 1 1 100% 10 10 100% 41 41 100% 3 3 100% 5 5 100% 1 2 2 100% 8 3 5 5 100% 7 7 2 5 4 80% 12 12 1 11 11 100% 100% 3 3 1 13 1 1 1 1 1 3 19 6 1 1 10 8 1 3 1 21 2 2 2 7 7 10 9 90% 20 20 100% 10 9 90% 19 19 100% 100% 36 36 25 22 88% 10 10 100% 80% 5 4 14 12 86% 99 99 100% 19 16 84% 2 2 100% 8 1 7 6 86% 4 2 2 2 100% 27 32.52.0201.01 BUSINESS MANAGEMENT TECH 2.3.AAS 45 2 43 6 37 37 100% 28 32.52.0299.01 CONTEMPORARY MANAGEMENT 2.3.AAS 38 1 37 2 35 35 100% 440 427 97% Programs Exempt from Job Placement Standard 2000 CIP Academic Program Degree 1 08.13.0101.00 TEACHING 2.3.AST 2 16.24.0101.01 GENERAL EDUCATION 2.3.AA, AS PROFESSIONAL STUDIES 2.3.AAS 3 16.24.0102.02 Total Percentage of Non-Respondents 520 15 505 55 3 5 1 1 3% Note: Please report all non-respondents by program. The 2009 graduates will be adjusted to reflect the removal of non-respondents. Maximum of non-respondents is limited to 5% for all programs. Institutional Comments (Optional): Tennessee Higher Education Commission Page 13 of 16 11/16/2011 Tennessee Higher Education Commission 2010-15 Performance Funding Standard 1F: Assessment Implementation The Assessment Implementation standard is designed to provide incentives for institutions to develop and sustain a mature and sophisticated assessment process while implementing a Quality Enhancement Plan (QEP) or Student Learning Initiative (SLI). Roane State Community College Year 1: 2010-11 Maximum Points: Recommended Points: 10 10 Year QEP or SLI Stage Title and Description 2010-11 QEP Sustaining The SAILS Project: Students Achieving Improved Learning Strategies 2011-12 QEP Sustaining The SAILS Project: Students Achieving Improved Learning Strategies 2012-13 QEP Sustaining The SAILS Project: Students Achieving Improved Learning Strategies 2013-14 QEP Sustaining The SAILS Project: Students Achieving Improved Learning Strategies 2014-15 QEP Sustaining The SAILS Project: Students Achieving Improved Learning Strategies Scoring Rubric for Assessment Implentation: Sustaining QEP (1) Present a short review of the QEP activity. (Why it was undertaken including goals and objectives? AND describe the actions for the year that were taken to (2) Describe the assessments taken during the year. (What were they and why were they used? What was the methodology? (3) Present this year's major assessment results with the addition of previous results, as they are available. (4) Discuss how the institution is improving the QEP based on the assessment results. (5) Evaluate the QP itself (what is working, working what is not working AND outline steps for next year (program implementation and assessment related). related) Faculty Evaluators' Comments: 1. Present a short review of the QEP/SLI activity (Why it was undertaken including goals and objectives?) AND describe the actions for the year that were taken to accomplish goals and objectives. [0‐2 points] [ ] 2 points The report provides a concise, yet thorough review of the activity to date and its rationale. The actions for this year are moving the project forward toward its goals and objectives. [ ] 1 point The report provides an adequate review of the activity and the actions for this year. [ ] 0 point The report gives a weak review of the activity or describes limited actions moving the activity forward, or both. Comments: The report demonstrated research‐based learning strategies and the faculty training component was very strong. 2. Describe the assessments taken during the year, (What were they and why were they used? What was the methodology?). [0‐1 points] [ ] 1 point The report describes a clear link between the assessments conducted and the stated objectives and goals of the QEP/SLI. The methodology used is appropriate to the measurement of stated goals and objectives. [ ] 0 point The report shows a weak link between the assessments conducted and aspects of student learning they measure, or the methodology used is not appropriate to the measurement of stated goals and objectives, or both. Comments: The assessments were very clearly defined and written in very clear language which easily communicated what the institution was trying to get accomplished. Tennessee Higher Education Commission Page 14 of 16 11/16/2011 communicated what the institution was trying to get accomplished. 3. Present this year’s major assessment results with the addition of previous results, as they are available. [0‐2 points] [ ] 2 points The report clearly presents the major results from this year’s assessments and, if applicable, incorporates these with the previous results so that the reader can follow the assessments over time. [ ] 1 point The report presents the major findings and, if applicable, incorporates these with previous findings. Information provided could be improved with a greater clarity of presentation. [ ] 0 point The assessment findings are lacking detail, difficult to understand, vague, or are minimally presented. Comments: The institution clearly identified the processes that were in place and addressed any missing data issues with a corrective action plan. 4. Discuss how the institution is improving the QEP/SLI based on the assessment results. [0‐3 points] [ ] 3 The report clearly describes how the institution plans to improve its QEP/SLI in points response to a thoughtful analysis of assessment results. Or, based on an analysis of assessment results, the report justifies that no improvement actions are required at this time. [ ] 2 points The report describes how the institution plans to improve its QEP/SLI and gives a general indication of how those improvements are related to assessments results. [ ] 1 point The report describes planned improvements to the QEP/SLI, but the improvements are difficult to understand or vague; or the report does not linked to improvements to assessment findings; or both. [ ] 0 point The report does not describe any planned improvements to the QEP/SLI, nor does it justify that improvement actions are not required at this time. Comments: The plan for improvement is very straight forward and easy to follow. 5. Evaluate the QEP/SLI itself (what is working, what is not working) AND outline steps for next year (program implementation and assessment related). [0‐2 points] [ ] 2 The report provides a thoughtful analysis of its QEP/SLI with observations about what is effective and what is not going as planned. The activities for next year are clearly points described. [ ] 1 point The report shows some reflection on the QEP/SLI at this stage. The activities for next year are listed. [ ] 0 point The report shows a lack of reflection or a weak reflection of the QEP/SLI at this stage. The activities for the next year are not adequately identified. Comments: The future plan is clear and concise. Overall the document was very well done and the project seemed to have great benefits for the students and the institution. Tennessee Higher Education Commission Page 15 of 16 11/16/2011 Tennessee Higher Education Commission 2010-15 Performance Funding Standard 2: Student Access and Student Success The Student Access and Success standard is designed to provide incentives for institutions to increase the number of graduates from select subpopulations. Each institution selected five subpopulations particularly important to their mission and this standard measures the quality of its services dedicated to those subpopulations. The measure of the institution’s commitment will be student subpopulation success – greater number enrolled, retained, and graduated. Roane State Community College Maximum Points: Recommended Points: 25 25 Year 1: 2010-11 No. Sub-Population 2006-07 2007-08 2008-09 3 Yr Avg Benchmark 2009-10 Attainment Percent Attained Pts Recommended 1 Adults 459 406 373 413 432 100% 5 2 Low Income 395 378 366 380 411 100% 5 3 Males 226 204 187 206 240 100% 5 4 Health Programs 309 289 288 295 314 100% 5 5 High Need Fields: Teaching AST and Contemporary Management 35 32 62 43 83 100% 5 Institutional Comments: Please place any comments in this text box. Tennessee Higher Education Commission Page 16 of 16 11/16/2011
