Nov. 5, 2015 Don Rosenberg Remarks GSMA-George Washington University
advertisement
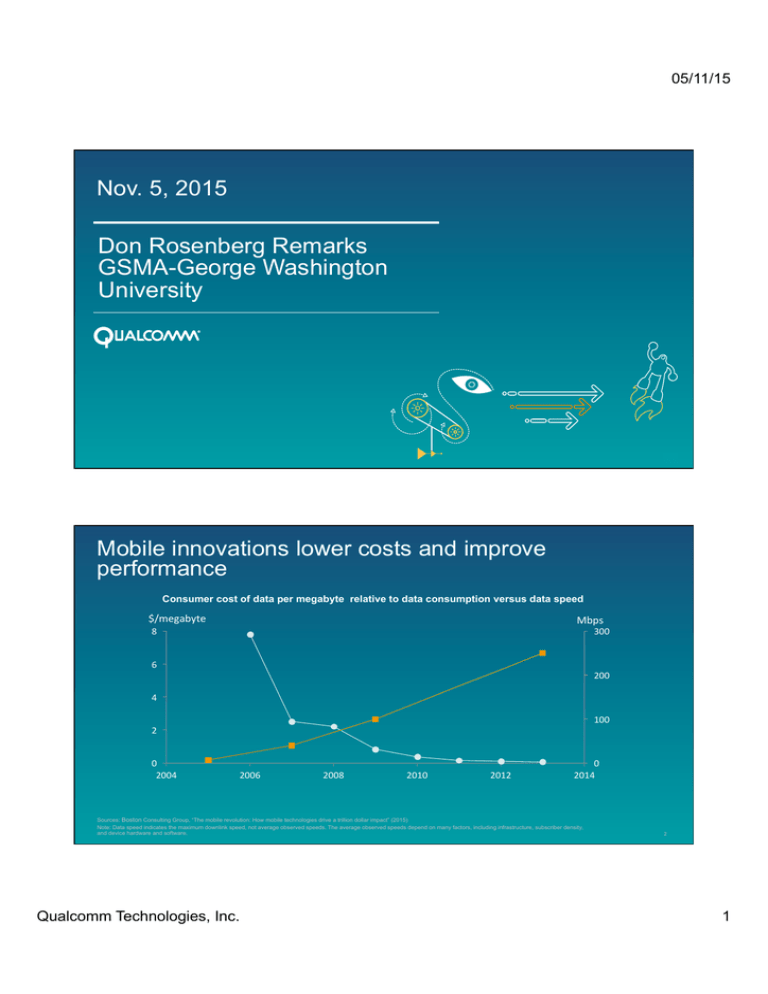
05/11/15 Nov. 5, 2015 Don Rosenberg Remarks GSMA-George Washington University 1 Mobile innovations lower costs and improve performance Consumer cost of data per megabyte relative to data consumption versus data speed $/megabyte Mbps 8 300 6 200 4 100 2 0 2004 2006 2008 2010 2012 0 2014 Sources: Boston Consulting Group, “The mobile revolution: How mobile technologies drive a trillion dollar impact” (2015) Note: Data speed indicates the maximum downlink speed, not average observed speeds. The average observed speeds depend on many factors, including infrastructure, subscriber density, and device hardware and software. Qualcomm Technologies, Inc. 2 1 05/11/15 Few participants invest in R&D No. of participating firms in 3GPP • Minority invest actively in R&D -- Fewer than half, ~45% of participants ever submitted any technical contribution. • Among those that did contribute their technology to standards, the distribution is highly skewed with the top 2% entities responsible for >60% of all contributions. 300 266 250 200 150 100 55 50 46 30 26 30 100-300 300-1,000 21 9 9 5,000-10,000 >10,000 0 0 1-10 10-50 50-150 1,000-5,000 No. of technical contributions (2005-2013) Sources: Baron and Gupta, “Unpacking 3GPP standards”, forthcoming, Journal of Economic and Management Strategy (2016), based on data from www.3gpp.org 3 The mobile wireless industry – development stages Standardized technology is developed Standards-compliant products are developed Interoperable networks are deployed Highest risk Medium risk Low risk Inter-standards competition Market adoption unknown Market adoption unknown Markets adopt technology Investment Risk Sources: Gupta, “Technology standards and competition in the mobile wireless industry”, GMU Law Review (2015) 4 Qualcomm Technologies, Inc. 2 05/11/15 R&D risks in core technologies enable major capex investments Mobile value chain R&D and capex-to-revenue ratios Percentage of revenue Technology-centric 30 Product-centric Network-centric 2 20 10 23 3 11 12 3 5 4 Component manufacturing OEMs 0 Technology and component innovaHon Telecom infrastructure 15 <21 Capex R&D Mobile network operators Sources: Boston Consulting Group, “The mobile revolution: How mobile technologies drive a trillion dollar impact” (2015) (based on data from Ovum; Gartner) Note: These figures come from pure players and represent a five-year average of R&D and capex-to-revenue ratios from 2009 through 2013. 1Mobile network operators typically do not report R&D spending separately from other expenses. 5 Thank you Follow us on: For more information, visit us at: www.qualcomm.com & www.qualcomm.com/blog © 2013-2015 Qualcomm Incorporated and/or its subsidiaries. All Rights Reserved. Qualcomm is a trademark of Qualcomm Incorporated, registered in the United States and other countries. Other products and brand names may be trademarks of registered trademarks of their respective owners. References in this presentation to Qualcomm may mean Qualcomm Incorporated, Qualcomm Technologies, Inc., and/or other subsidiaries or business units within the Qualcomm corporate structure, as applicable. Qualcomm Incorporated includes Qualcomm’s licensing business, QTL, and the vast majority of its patent portfolio. Qualcomm Technologies, Inc., a wholly-owned subsidiary of Qualcomm Incorporated, operates, along with its subsidiaries, substantially all of Qualcomm’s engineering, research and development functions, and substantially all of its product and services businesses, including its semiconductor business, QCT. 6 Qualcomm Technologies, Inc. 3
