b a c h F R E E
advertisement

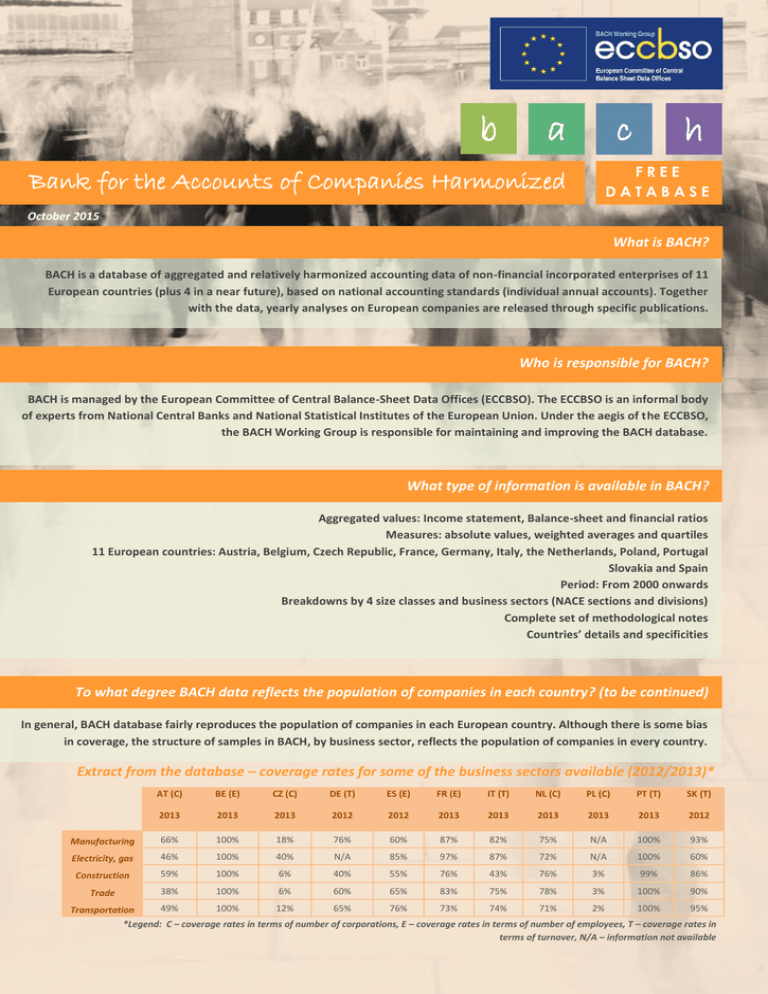
b a c h FREE DATABASE Bank for the Accounts of Companies Harmonized October 2015 What is BACH? BACH is a database of aggregated and relatively harmonized accounting data of non-financial incorporated enterprises of 11 European countries (plus 4 in a near future), based on national accounting standards (individual annual accounts). Together with the data, yearly analyses on European companies are released through specific publications. Who is responsible for BACH? BACH is managed by the European Committee of Central Balance-Sheet Data Offices (ECCBSO). The ECCBSO is an informal body of experts from National Central Banks and National Statistical Institutes of the European Union. Under the aegis of the ECCBSO, the BACH Working Group is responsible for maintaining and improving the BACH database. What type of information is available in BACH? Aggregated values: Income statement, Balance-sheet and financial ratios Measures: absolute values, weighted averages and quartiles 11 European countries: Austria, Belgium, Czech Republic, France, Germany, Italy, the Netherlands, Poland, Portugal Slovakia and Spain Period: From 2000 onwards Breakdowns by 4 size classes and business sectors (NACE sections and divisions) Complete set of methodological notes Countries’ details and specificities To what degree BACH data reflects the population of companies in each country? (to be continued) In general, BACH database fairly reproduces the population of companies in each European country. Although there is some bias in coverage, the structure of samples in BACH, by business sector, reflects the population of companies in every country. Extract from the database – coverage rates for some of the business sectors available (2012/2013)* AT (C) BE (E) CZ (C) DE (T) ES (E) FR (E) IT (T) NL (C) PL (C) PT (T) SK (T) 2013 2013 2013 2012 2012 2013 2013 2013 2013 2013 2012 Manufacturing 66% 100% 18% 76% 60% 87% 82% 75% N/A 100% 93% Electricity, gas 46% 100% 40% N/A 85% 97% 87% 72% N/A 100% 60% Construction 59% 100% 6% 40% 55% 76% 43% 76% 3% 99% 86% Trade 38% 100% 6% 60% 65% 83% 75% 78% 3% 100% 90% 49% 100% 12% 65% 76% 73% 74% 71% 2% 100% 95% Transportation *Legend: C – coverage rates in terms of number of corporations, E – coverage rates in terms of number of employees, T – coverage rates in terms of turnover, N/A – information not available b a c h To what degree BACH data reflects the population of companies in each country? (continuation) Extract from the database – structure of the sample (structure of the population in brackets) (2012/13) (%)* AT (C) BE (E) CZ (C) DE (T) ES (E) FR (E) IT (T) NL (C) PL (C) PT (T) SK (T) 2013 2013 2013 2012 2012 2013 2013 2013 2013 2013 2012 Manufacturing 13 (8) 24 (24) 25 (N/A) 41 (38) 19 (19) 24 (21) 39 (36) 7 (7) N/A 26 (26) 32 (N/A) Electricity, gas 1 (1) 1 (1) 3 (N/A) 18 (12) 1 (0) 2 (1) 9 (8) 0 (0) N/A 6 (6) 3 (N/A) Construction 15 (11) 10 (10) 7 (N/A) 2 (3) 8 (9) 9 (9) 3 (5) 9 (8) 10 (13) 6 (6) 5 (N/A) Trade 20 (23) 21 (22) 16 (N/A) 22 (26) 23 (23) 22 (21) 30 (30) 23 (20) 30 (28) 37 (37) 31 (N/A) Transportation 5 (4) 10 (10) 3 (N/A) 4 (4) 7 (6) 9 (9) 5 (5) 3 (3) 6 (8) 6 (6) 6 (N/A) *Legend: C – weight of the sector in terms of number of corporations, E – weight of the sector in terms of number of employees, T – weight of the sector in terms of turnover, N/A – information not available When is data usually made available? The majority of the countries reports preliminary data until the end of the following year. For example, 2014 data will be made available, in general, until the end of 2015. What can be done with BACH data? BACH data is quite useful for analysis about the evolution and situation of companies in Europe. In particular, it has been used for cross-countries comparisons. How to get access to BACH and related publications? BACH database is available for free at: http://www.bach.banque-france.fr/?lang=en (Note: BACH website is hosted by Banque de France) Outlook #3: Developments in the leveraging process of European companies: Some effects on the asset side Outlook booklets: compares recent trends in economic and financial issues of the European companies making use of the information available within the BACH database Yearly Get Insights: 2013 Yearly Get Insights: yearly portfolio of selected economic and financial indicators enabling to get easily a picture of the most recent situation of European companies Userguide: 2013 data Userguide: covers the methodology underpinning the data following a userfriendly approach. It supports the process of observing variables to obtain the extra information needed to compare data Next update: October 2016


