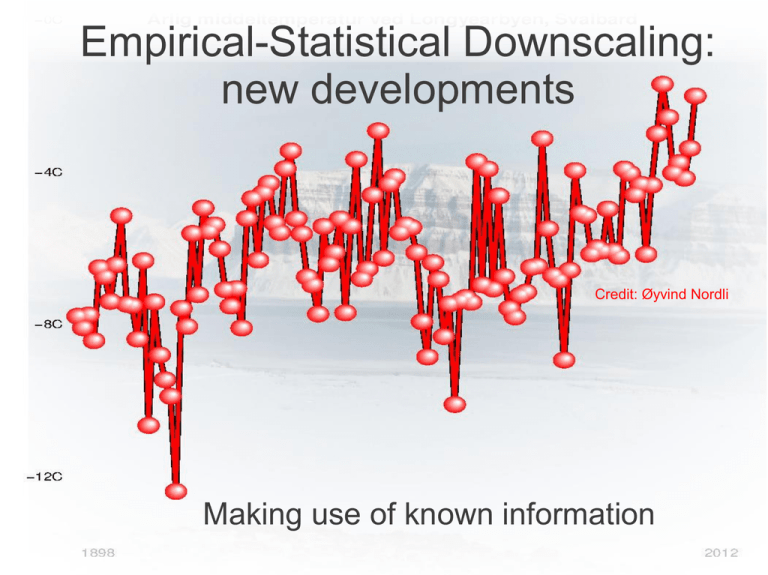
Empirical-Statistical Downscaling: new developments Making use of known information Credit: Øyvind Nordli
advertisement
Empirical-Statistical Downscaling: new developments Credit: Øyvind Nordli Making use of known information ESD for different situations ● ● Whenever the large-scale ambient environment sets the stage... – Temperature statistics – Precipitation statistics – Storms? Extremes? Time series first? ● ● ● ● “Weather”: a chronological time series “Climate”: a frequency distribution (PDF) Traditional: time series → PDF Alternative: PDF → time series Traditional ● ● Distribution from ENSEMBLE spread CMIP5 – test. Right distribution type? ● CMIP5 members, approximately normally distributed... Can we predict the shape of the PDFs instead? ● ● ● Already predict the mean – e.g. the monthly mean. What about the standard deviation? N(x,σ) Temperature statistics ● ● Not just monthly mean values 3 following summers Range as well as mean vary 5%-95% ● 24-hr precipitation ● Different type of PDF ● Different dependencies to the large scales ● ● – The hydrological cycle – Energy flow: latent heat. More complicated – two situations: – Dry days – Rainy days Traditionally: monthly means... Wet-day precipitation All-day precipitation Sensitivity test Mean Temperature Number of days with data Logit! Wet-day mean GDCN Logit! Number of wet days Simple wet-day PDF? Exponential distribution: qp = -ln(1-p) µ. qp -ln(1-p) µ Wet-day percentiles... Observed q95 q95=f(µ,fw,z,d) Mm/day Validation of PCA-based formulae Temporal variations... 10-year 24-hr precipitation ● 10-year statistics vary External dependencies? 5%-95% ● Trend analysis Link to global mean temperature: µ Wet-day frequency & global t(2m) Wind & storms... Seasonal dependencies – an opportunity for statistical modelling? Mid-latitude storms from IMILAST Storms... ● ● Temperature – Mean [ok] – Standard deviation? Other distributions? Precipitation – ● Wet-day mean µ and wet-day frequency fw. Wind – Storm tracks?


