High resolution bed level changes on an intertidal mudflat
advertisement

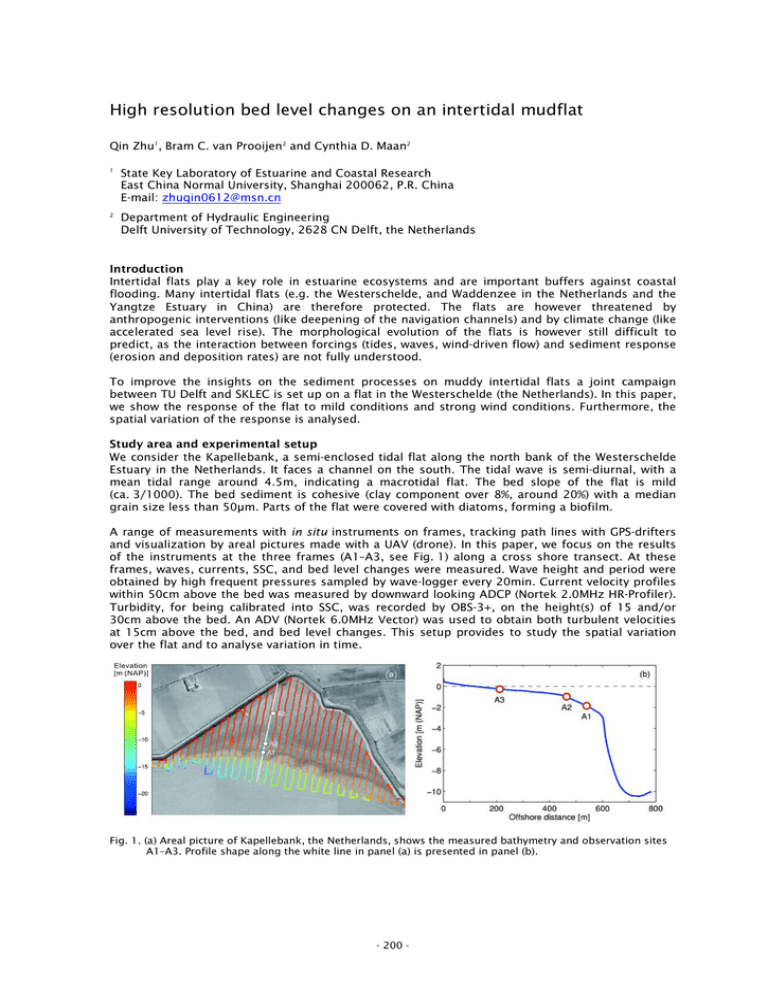
High resolution bed level changes on an intertidal mudflat Qin Zhu1, Bram C. van Prooijen2 and Cynthia D. Maan2 1 State Key Laboratory of Estuarine and Coastal Research East China Normal University, Shanghai 200062, P.R. China E-mail: zhuqin0612@msn.cn 2 Department of Hydraulic Engineering Delft University of Technology, 2628 CN Delft, the Netherlands Introduction Intertidal flats play a key role in estuarine ecosystems and are important buffers against coastal flooding. Many intertidal flats (e.g. the Westerschelde, and Waddenzee in the Netherlands and the Yangtze Estuary in China) are therefore protected. The flats are however threatened by anthropogenic interventions (like deepening of the navigation channels) and by climate change (like accelerated sea level rise). The morphological evolution of the flats is however still difficult to predict, as the interaction between forcings (tides, waves, wind-driven flow) and sediment response (erosion and deposition rates) are not fully understood. To improve the insights on the sediment processes on muddy intertidal flats a joint campaign between TU Delft and SKLEC is set up on a flat in the Westerschelde (the Netherlands). In this paper, we show the response of the flat to mild conditions and strong wind conditions. Furthermore, the spatial variation of the response is analysed. Study area and experimental setup We consider the Kapellebank, a semi-enclosed tidal flat along the north bank of the Westerschelde Estuary in the Netherlands. It faces a channel on the south. The tidal wave is semi-diurnal, with a mean tidal range around 4.5m, indicating a macrotidal flat. The bed slope of the flat is mild (ca. 3/1000). The bed sediment is cohesive (clay component over 8%, around 20%) with a median grain size less than 50µm. Parts of the flat were covered with diatoms, forming a biofilm. A range of measurements with in situ instruments on frames, tracking path lines with GPS-drifters and visualization by areal pictures made with a UAV (drone). In this paper, we focus on the results of the instruments at the three frames (A1–A3, see Fig. 1) along a cross shore transect. At these frames, waves, currents, SSC, and bed level changes were measured. Wave height and period were obtained by high frequent pressures sampled by wave-logger every 20min. Current velocity profiles within 50cm above the bed was measured by downward looking ADCP (Nortek 2.0MHz HR-Profiler). Turbidity, for being calibrated into SSC, was recorded by OBS-3+, on the height(s) of 15 and/or 30cm above the bed. An ADV (Nortek 6.0MHz Vector) was used to obtain both turbulent velocities at 15cm above the bed, and bed level changes. This setup provides to study the spatial variation over the flat and to analyse variation in time. Fig. 1. (a) Areal picture of Kapellebank, the Netherlands, shows the measured bathymetry and observation sites A1–A3. Profile shape along the white line in panel (a) is presented in panel (b). - 200 - Results and conclusions A 23-day record, covering more than a spring–neap cycle, of water level variation, orbital velocities and bed level changes is shown in Fig. 2. Increased wind speeds were found in the period between May 6 and May 13. This is directly affecting the orbital velocity at frame A, as shown in Fig. 2b. During the strong wind period, wave heights increase and oscillate in time by the tidal variation of the water depth. Maximum orbital velocities are found during shallow water as a consequence of smaller ratios of wave length over water depth and as a consequence of shoaling. Significant bed level degradation events are found during shallow water depth periods at A1, see Fig. 1d. The bed level lowered more than 2cm during the low water at the 11th of May. At this low water period, the bed at frame A did not fall dry, implying a relatively long period of severe conditions. After the strong wind period, the bed level almost recovered within a period 10 days. The sites at A2 and A3 do not show a similar significant response. Almost no bed level variation was found during the strong wind period. The difference between site A1 on the one hand and sites A2 and A3 on the other hand can be explained by the exposure to waves at low tide. Locations A2 and A3 are not flooded during low tide, while A1 is flooded during the full tidal cycle during neap tide. A similar strong wind during spring tide would have had much less impact on site A1, as it would have fallen dry during low tide. Furthermore, it is noticed that significant sediment transport takes place during shallow water conditions. Not only high concentrations occur, but also significant bed level changes. It is concluded that the sensitivity to erosion is maximum at the elevation just below the low water level. These conditions, however, are generally not well simulated by numerical models. Fig. 3. Time series of (a) water level (h) gauged at Hansweert, which is close to our study area, by Rijkswaterstaat, the Netherlands, (b) significant wave height (H s ) at site A1, (c) turbidity obtained by OBS attached on Vector, and (d)–(f) bed level changes measured by ADV at site A1, A2 and A3. Negative ξ in panels (c)–(e) means the distance between ADV transmitter and bed surface. - 201 -


