EFFECTS OF WILDFIRE ON DENSITIES OF SECONDARY NORTHERN ARIZONA
advertisement
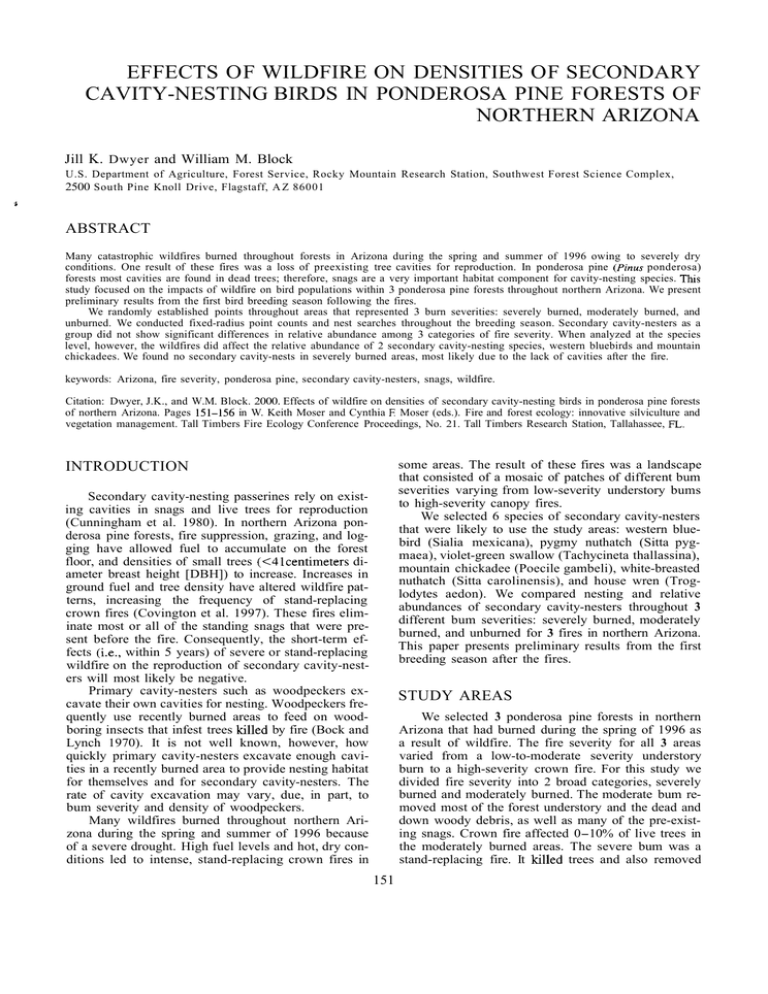
EFFECTS OF WILDFIRE ON DENSITIES OF SECONDARY CAVITY-NESTING BIRDS IN PONDEROSA PINE FORESTS OF NORTHERN ARIZONA Jill K. Dwyer and William M. Block U.S. Department of Agriculture, Forest Service, Rocky Mountain Research Station, Southwest Forest Science Complex, 2500 South Pine Knoll Drive, Flagstaff, A Z 86001 * ABSTRACT Many catastrophic wildfires burned throughout forests in Arizona during the spring and summer of 1996 owing to severely dry conditions. One result of these fires was a loss of preexisting tree cavities for reproduction. In ponderosa pine (Pinus ponderosa) forests most cavities are found in dead trees; therefore, snags are a very important habitat component for cavity-nesting species. Thls study focused on the impacts of wildfire on bird populations within 3 ponderosa pine forests throughout northern Arizona. We present preliminary results from the first bird breeding season following the fires. We randomly established points throughout areas that represented 3 burn severities: severely burned, moderately burned, and unburned. We conducted fixed-radius point counts and nest searches throughout the breeding season. Secondary cavity-nesters as a group did not show significant differences in relative abundance among 3 categories of fire severity. When analyzed at the species level, however, the wildfires did affect the relative abundance of 2 secondary cavity-nesting species, western bluebirds and mountain chickadees. We found no secondary cavity-nests in severely burned areas, most likely due to the lack of cavities after the fire. keywords: Arizona, fire severity, ponderosa pine, secondary cavity-nesters, snags, wildfire. Citation: Dwyer, J.K., and W.M. Block. 2000. Effects of wildfire on densities of secondary cavity-nesting birds in ponderosa pine forests of northern Arizona. Pages 151-156 in W. Keith Moser and Cynthia E Moser (eds.). Fire and forest ecology: innovative silviculture and vegetation management. Tall Timbers Fire Ecology Conference Proceedings, No. 21. Tall Timbers Research Station, Tallahassee, FL. some areas. The result of these fires was a landscape that consisted of a mosaic of patches of different bum severities varying from low-severity understory bums to high-severity canopy fires. We selected 6 species of secondary cavity-nesters that were likely to use the study areas: western bluebird (Sialia mexicana), pygmy nuthatch (Sitta pygmaea), violet-green swallow (Tachycineta thallassina), mountain chickadee (Poecile gambeli), white-breasted nuthatch (Sitta carolinensis), and house wren (Troglodytes aedon). We compared nesting and relative abundances of secondary cavity-nesters throughout 3 different bum severities: severely burned, moderately burned, and unburned for 3 fires in northern Arizona. This paper presents preliminary results from the first breeding season after the fires. INTRODUCTION Secondary cavity-nesting passerines rely on existing cavities in snags and live trees for reproduction (Cunningham et al. 1980). In northern Arizona ponderosa pine forests, fire suppression, grazing, and logging have allowed fuel to accumulate on the forest floor, and densities of small trees (<4lcentimeters diameter breast height [DBH]) to increase. Increases in ground fuel and tree density have altered wildfire patterns, increasing the frequency of stand-replacing crown fires (Covington et al. 1997). These fires eliminate most or all of the standing snags that were present before the fire. Consequently, the short-term effects (i.e., within 5 years) of severe or stand-replacing wildfire on the reproduction of secondary cavity-nesters will most likely be negative. Primary cavity-nesters such as woodpeckers excavate their own cavities for nesting. Woodpeckers frequently use recently burned areas to feed on woodboring insects that infest trees killed by fire (Bock and Lynch 1970). It is not well known, however, how quickly primary cavity-nesters excavate enough cavities in a recently burned area to provide nesting habitat for themselves and for secondary cavity-nesters. The rate of cavity excavation may vary, due, in part, to bum severity and density of woodpeckers. Many wildfires burned throughout northern Arizona during the spring and summer of 1996 because of a severe drought. High fuel levels and hot, dry conditions led to intense, stand-replacing crown fires in STUDY AREAS We selected 3 ponderosa pine forests in northern Arizona that had burned during the spring of 1996 as a result of wildfire. The fire severity for all 3 areas varied from a low-to-moderate severity understory burn to a high-severity crown fire. For this study we divided fire severity into 2 broad categories, severely burned and moderately burned. The moderate bum removed most of the forest understory and the dead and down woody debris, as well as many of the pre-existing snags. Crown fire affected 0-10% of live trees in the moderately burned areas. The severe bum was a stand-replacing fire. It killed trees and also removed 151 152 DWYER AND BLOCK the forest understory and dead and downed woody debris. Crown fire killed approximately 99% of live trees in severely burned areas. All sites included control points in unburned areas that were similar to burned areas in terms of preburn stand structure and species composition. The Horseshoehiochderffer fire complex, located approximately 30 kilometers north of Flagstaff, burned approximately 10,140 hectares of forest consisting predominantly of ponderosa pine canopy and understory. This site contained 50 survey points throughout 6 severely burned areas, 50 survey points in 4 moderately burned areas, and 50 survey points in 4 unburned areas. The average elevation of survey points within the Horseshoehiochderffer complex was about 2,300 meters. Approximately 2,360 hectares of ponderosa pine forest burned as a result of the Pot fire, located approximately 70 kilometers south of Flagstaff. The dominant vegetation type for this area was ponderosa pine with a Gambel oak (Quercus gambelii) understory. We established 20 points throughout 2 moderately burned areas and 20 points throughout 2 unburned areas at the Pot fire site. The average elevation of survey points within this fire was about 2,100 meters. The Bridger-Knoll fire, located on the north rim of the Grand Canyon on the Kaibab Plateau, consumed approximately 6,475 hectares of ponderosa pine forest. This area consisted predominantly of ponderosa pine with small patches of quaking aspen (Populus tremuloides), and a scattered understory that included Gambe1 oak and one-seed juniper (Juniperus monosperma). Two unburned areas and 2 moderately burned areas contained 20 points each within this site. The average elevation of survey points within this fire was about 2.280 meters. METHODS All 3 fires had points in moderately burned and unburned areas. w e could not establish sampling points in severely burned parts of the Pot and BridgerKnoll fires because of salvage logging in these areas. The Horseshoe/Hochderffer fire complex, therefore, was the only site that included survey points in severely burned areas. To locate survey points, we used a systematic-random-sampling scheme, somewhat constrained due to the size and shape of the burned patches. For each stand sampled, we randomly placed the first point and then established points every 200 meters, conforming to the stand's shape and size. For the purpose of this study, we defined stands by fire severity. To avoid edge effects, all points were located 2100 meters from stand boundaries. Bird-count Data Three observers conducted 50-meter, fixed-radius point counts (Petit et al. 1995) throughout each study area to estimate an index of abundance for secondary cavity-nesters. Each observer counted all transects once to help control for observer bias. Consequently, we sampled each point 3 times during the 1997 breeding season (1 May-15 July), which also controlled for seasonal variability in bird behavior and detectability. Point counts began within 30 minutes after sunrise and ended no later than 4 hours after sunrise. Observers waited 2 minutes after they arrived at a point to begin counting. This method allowed bird behavior in the surrounding area to return to normal after the disturbance of the observer arriving at the point. After the 2-minute waiting period, the observer listened for 8 minutes and recorded every bird seen or heard by species, sex, age, horizontal distance from the observer, and mode of detection. Cavity-nesting Data To estimate the nesting populations of secondary cavity-nesters, we monitored natural cavities for activity. Observers attempted to locate all occupied cavities within the 50-meter radius of each point. Observers monitored cavities from a distance (5-20 meters) that did not disturb the birds' normal activity. Data Analysis Analysis involving all 3 study areas was restricted to comparisons between moderately burned and unburned sites. Analysis done within the Horseshoe1 Hochderffer study area compared severely burned, moderately burned, and unburned sites. To obtain equal sample sizes from each fire, we used a random sample of 20 points from both moderately burned and unburned areas from the Horseshoe/Hochderffer site. Comparisons of Relative Abundances We analyzed data at different scales to evaluate whether relationships were site-specific, or applied to all study sites. We first pooled data from all 3 study areas to compare relative abundances between moderately burned and unburned sites. Comparisons of relative abundances were then done within and among study areas, and between or among fire severities. A11 analyses were done for secondary cavity-nesters as a group, and for individual species comprising this group. We averaged the number of birds detected during the 3 point-count visits to obtain a relative abundance for each point, and a total mean relative abundance for each burn severity. We used a one-way analysis of variance (ANOVA) (Sokal and Rohlf 1969: 176-181) to detect differences in relative abundance. We used Levene's test for homogeneity among variances (Milliken and Dallas 1984:473) to determine which pairwise comparison method to use in the post hoc analysis of comparisons involving 3 groups. If variances were heterogeneous among groups, we used Dunnett's T3 test (Dunnett 1980); if variances were homogeneous, we used Tukey's post hoc comparison (Neter et al. 1996:725-732). We set the type I error rate (a) at 0.05 for ANOVA's involving secondary cavity-nesters as a group. To control type I error rates for compari- FIRE EFFECTS ON SECONDARY CAVITY-NESTING BIRDS 153 Table 1. Densities (number per 40 hectares and standard deviation in parentheses) of cavity-nesting birds during the 1997 breeding season throughout moderately burned areas of the Horseshoe/Hochderffer, Pot, and Bridger-Knoll fires in northern Arizona. P Moderate 5 5 10 Unburned 2 15 E .2 Species Horseshoe1 Hochderffer Mountain Chickadee 5.1 Pygmy Nuthatch 5.1 Violet-green Swallow 2.6 White-breasted Nuthatch 4.2 Western Bluebird 23.8 5 Q) 0 0 VGSW MOCH PYNU WEBL WBNU Fig. 1. Densities (number per 40 hectares) of cavity-nesting birds throughout 2 fire severities during the 1997 breeding season for the Horseshoe/Hochderffer,Pot, and Bridger-Knoll fires in northern Arizona. Error bars represent standard errors. Mountain chickadees (MOCH), pygmy nuthatches (PYNU), violetgreen swallows (VGSW), white-breasted nuthatches (WBNU), and western bluebirds (WEBL) did not show significant differences (P s 0.05) in abundance between moderate and unburned fire severities. sons of individual species, we adjusted P-values by multiplying the reported P for each test by the number of species compared. Comparisons with Data Pooled Across Study Areas.-From each study area, we pooled data from the moderately burned and unburned sites to evaluate whether obvious patterns existed in bird response to fire severity. We then conducted one-way ANOVA's to test for differences in relative abundance for secondary cavity-nesters as a group, and then for each species. Comparisons of Relative Abundances Among Study Areas.-We tested to evaluate whether relative abundances differed among study areas. We conducted 2 separate tests: one to compare abundances in moderate bums among sites, and the other to compare abundances in unburned sites. Comparisons of Relative Abundances Within Study Areas.-For the Pot and Bridger-Knoll fires we compared relative abundances between moderately burned and unburned sites. Because we also sampled severely burned sites at HorseshoeMochderffer, we conducted 3-group tests using all 50 points from each fire severity class. BridgerKnoll (9.7)Aa 1.7 (5.2)A (19.2)AB 24.6 (26.1)A (11.4)A 0.8 (3.8)A (7.5)B (46.2)A 16.1 (14.O)A 15.3 (21.3)A Pot 6.8 (20.2)A 0.8 (3.8)B 3.4 (6.9)A 4.2 (7.5)B 17.0 (31.7)A a Within a species, means followed by a different letter are significantly different (P 5 0.05) according to Dunnett's T3 multiple comparison procedure. for secondary cavity-nesters as a group when all 3 fires were considered (F = 1.222, df = 1, P = 0.271). At the species level we did not detect significant differences in abundance (Figure I), but violet-green swallows were nearly significant for differences in relative abundance between moderately burned and unburned areas (F = 6.321, df = 1, P = 0.065, Power = 46%). Western bluebirds, white-breasted nuthatches, mountain chickadees, and pygmy nuthatches did not show significant differences in relative abundance between moderately burned and unburned areas (P > 0.05). We detected house wrens only twice at the Bridger-Knoll site and we did not detect them at the Horseshoe1 Hochderffer and Pot fires, so we did not include this species in the analysis. RESULTS Comparisons of Relative Abundance Among Study Areas We did not detect differences in relative abundance between sites for secondary cavity-nesters as a group in moderately burned areas ( F = 1.887, df = 2, P = 0.161). At the species level, the results for pygmy and white-breasted nuthatches did show some significant differences between areas (Table 1). Pygmy nuthatches were more abundant in the Bridger-Knoll fire than the Pot fire (P = 0.01). White-breasted nuthatches were more abundant in the Bridger-Knoll fire than in the HorseshoeMochderffer or Pot fires (P = 0.005 and P = 0.005). Mountain chickadees, violet-green swallows, and western bluebirds did not show significant differences in abundance between moderately burned areas (P > 0.05). We did detect differences in relative abundance for secondary cavity-nesters as a group between sites in unburned areas (F = 6.53, df = 2, P = 0.003). Secondary cavity-nesters were more abundant in the Pot fire than in the HorseshoeMochderffer and BridgerKnoll fires (P = 0.002, P = 0.002). When analyzed at the species level, we did not detect differences in relative abundance between sites in unburned areas (Table 2). Comparisons of Relative Abundance with Data Pooled Across Study Areas Comparisons of Relative Abundance Within Study Areas We did not detect a difference in relative abundance between moderately burned and unburned areas Secondary cavity-nesters as a group did not show a significant difference in relative abundance among Comparisons of Nest Densities We tested for differences in total number of nests among bum severity using a chi-square goodness of fit test (Sokal and Rohlf 1969561-566). We conducted all analyses for secondary cavity-nesters as a group and for 5 individual species. 154 DWYER AND BLOCK Table 2. Densities (number per 40 hectares and standard deviation in parentheses) of cavity-nesting birds during the 1997 breeding season throughout unburned areas of the Horseshoe1 Hochderffer, Pot, and Bridger-Knoll fires in northern Arizona. Table 3. Densities (number per 40 hectares and standard deviation in parentheses) of cavity-nesting birds throughout 3 fire severities during the 1997 breeding season for the Horseshoe1 Hochderffer fire in northern Arizona. Horseshoe1 BridgerSpecies Hochderffer Knoll Pot Mountain Chickadee 5.9 (11 .4)Aa 1.7 (5.2)A 16.1 (31.4)A Pygmy Nuthatch 11.0 (20.1)A 6.8 (1 9.4)A 23.7 (30.9)A Violet-green Swallow 2.6 (8.3)A 8.5 (17.O)A 18.7 (32.1)A White-breasted Nuthatch 2.6 (8.3)A 16.1 (21.O)A 12.7 (16.4)A Western Bluebird 0.8 (3.8)A 11.0 (16.8)A 12.7 (16.4)A a Within a species, means followed by a different letter are significantly different (P 5 0.05) according to Dunnett's T3 multiple comparison procedure. Severely Moderately Species burned burned Unburned Mountain Chickadee 0.0 (O.O)Ba 5.2 (1 1.6)A 12.1 (22.7)A Pygmy Nuthatch 1.4 (5.8)A 6.6 (18.0)A 11.4 (23.9)A Violet-green Swallow 2.1 (12.3)A 2.4 (8.5)A 2.4 (7.8)A White-breasted Nuthatch 1.4 (4.7)A 4.5 (7.5)A 2.4 (7.8)A Western Bluebird 11.1 (16.8)A 14.4 (31.4)AB 1.7 (6.2)B a Within a species, means followed by a different letter are significantly different (P 5 0.05) according to Dunnett's T3 multiple comparison procedure. burn severity for the HorseshoeMochderffer fire (F = 2.99, df = 2, P = 0.053, Power = 57%). When analyzed at the species level, 2 species, mountain chickadees and western bluebirds, showed significantly different relative abundances between burn severity (Table 3). Mountain chickadees were more abundant in unburned areas than in severely burned (P = 0.01) or moderately burned (P = 0.045) Horseshoe/Hochderffer areas. Western bluebirds were more abundant in severely burned areas than in unburned areas (P = 0.01). Other species either were not found on the HorseshoeHochderffer plots, or did not show significant differences in abundance between fire severity (Table 3). The Bridger-Knoll fire (Figure 2) did not show significant differences in relative abundances for secondary cavity-nesters as a group or individual species (P > 0.05). At the Pot fire, however, secondary cavitynesters were more abundant in unburned areas than in moderately burned areas (F = 10.38, df = 1, P = 0.003). In addition, at the species level, pygmy nuthatches were more abundant in unburned areas than in moderately burned areas (P = 0.01) at the Pot fire (Figure 3). burned areas; therefore, it may not be entirely valid to pool the data from all 3 areas. We thought it was important, however, to report results from the pooled data to allow us to compare trends in the data. Moderate bums did not appear to have an effect on secondary cavity-nester abundance. It is possible that the vegetation structure in the moderately burned areas was not changed in ways that impacted secondary cavity-nesters. Horton and Mannon (1988) also found no significant differences in abundance for white-breasted nuthatches, pygmy nuthatches, and western bluebirds after a prescribed understory burn. Comparisons of Relative Abundances Among All 3 Fire Severities Secondary cavity-nesters as a group did not differ in abundance among categories of fire severity. At the species level, however, some species showed a difference in abundance. The 6 species studied are all primarily insectivorous, but foraging methods differ among the species (Szaro et al. 1990). Differences in individual species' response to fire may result from the Comparisons of Nest Densities We found 13 nests in unburned areas and 9 nests in moderately burned areas. We located 5 western bluebird nests, 4 violet-green swallow nests, 2 pygmy nuthatch nests, and 2 mountain chickadee nests in unburned areas. Nests found in moderately burned areas consisted of 5 western bluebird nests and 2 mountain chickadee nests. We did not find any secondary cavitynests in severely burned sites. We found no significant differences between bum severity for number of nests found in the HorseshoeMochderffer fire (x2 = 6.72, df = 2, P = 0.960), or between moderately burned and unburned areas for data from all 3 fires (x2 = 1.07, df = 1, P = 0.900). DISCUSSION Comparisons of Relative Abundances Between Moderately Burned and Unburned Areas We detected a significant difference in abundance between study sites for moderately burned and un- - U) $ 25 C 0 0 2 20 3 g Moderate 15 Unburned 5 5 10 ZI c. .2 al 5 0 0 WEBL VGSW MOCH PYNU WBNU Fig. 2. Densities (number per 40 hectares) of cavity-nesting birds throughout 2 fire severities during the 1997 breeding season for the Bridger-Knollfire complex in northern Arizona. Error bars represent standard errors. Mountain chickadees (MOCH), pygmy nuthatches (PYNU), violet-green swallows (VGSW), white-breasted nuthatches (WBNU), and western bluebirds (WEBL) did not show significant differences ( P 5 0.05) in abundance between moderate and unburned fire severities. FIRE EFFECTS ON SECONDARY CAVITY-NESTING BIRDS 155 Comparisons of Nest Densities 3 0 - - ;= 20 Q) v 2 Moderate Unburned $ 15 5 s 10 - .-5. 2 E 5 0 VGSW MOCH * PYNU WEBL WBNU Fig. 3. Densities (number per 40 hectares) of cavity-nesting birds throughout 2 fire severities during the 1997 breeding season for the Pot fire in northern Arizona. Error bars represent standard errors. Pygmy nuthatches (PYNU) were more abundant in unburned areas than in moderately burned areas (P = 0.003), signified by *. Mountain chickadees (MOCH), violetgreen swallows (VGSW), white-breasted nuthatches (WBNU), and western bluebirds (WEBL) did not show significant differences (P s 0.05) in abundance between moderate and unburned fire severities. changes in habitat components that favor certain foraging methods. For example, mountain chickadees are foliagegleaners; therefore, the loss of foliage from a severe burn could result in a decline in abundance of this species, as our results suggest (Table 3). Taylor and Barmore (1980) also reported that mountain chickadees declined in abundance in severely burned areas, and this species is known to increase or show no changes in abundance following a moderate or prescribed burn (Taylor and Barmore 1980, Horton and Mannan 1988). Our results also showed no significant differences between the moderately burned and unburned sites (Figure 1). The differences in abundance between severely burned and unburned points was not significant (P = 0.095) for pygmy nuthatches, a bark-gleaning species (Table 3). Although these results were not statistically significant, they may be biologically significant. Lowe et al. (1978) found that bark-gleaning species including pygmy nuthatches declined in abundance as a result of severe wildfire. The severe burn may have altered the arthropod prey base, but we did not sample arthropod abundance. The western bluebird was the only species whose abundance increased in response to fire (Table 3). Increases in abundance of western bluebirds in recently burned areas also was reported by Blake (1982) and Johnson and Wauer (1996). We found more western bluebirds in the severely burned areas than in the unburned areas. The severe burns removed understory vegetation, and may have created habitat favorable for ground feeders such as western bluebirds. In addition, there was likely an increase of arthropods in the severely burned areas, which may have attracted bluebirds. The lack of significant differences between fire severity for the total number of secondary cavity-nests found could be due to a low sample size. Although the nesting data did not show any statistically significant differences, there is still biological significance in these results. The fact that we did not find any secondary cavity-nests in the severe bum suggests a negative impact on the nesting populations of these species. The primary cavity-nesters frequently foraged in severely burned areas, but they did not appear to be excavating cavities 1 year after the fire. The loss of prefire snags, combined with an absence of cavities in newly created snags in severely burned areas, resulted in a lack of suitable nest sites for cavity-nesters. We would like to emphasize that these are shortterm results based on only 1 breeding season. We intend to continue this study over a longer period, and also throughout the non-breeding season, as patterns of bird use may vary among seasons. Moreover, we plan to test whether cavities are limiting secondary cavity-nesters' abundance by artificially increasing cavities with nest boxes. We will conduct point counts and nest searches again, and begin bird box monitoring during the second postfire breeding season. In addition, we will compare vegetation structure and composition to develop habitat relationships for secondary cavity-nesters. We hope to continue to learn more about bird responses to these 3 fires as we collect more data and continue to add to the study. ACKNOWLEDGMENTS We thank G. Martinez, R. White, B. Strohrneyer, J. Iniguez, A. Iniguez, and M. Stoddard for their excellent work in helping collect field data. We also thank the Peaks, Long Valley, and North Kaibab Ranger Districts for their continuing support and cooperation during this project. R. King and D. Turner supplied help with project design and statistical analysis. J. Ganey and C. Chambers reviewed earlier drafts of this paper. LITERATURE CITED Blake, J.G. 1982. Influence of fire and logging on nonbreeding bird communities of ponderosa pine forests. Journal of Wildlife Management 46:4O4-4 15. Bock, C.E., and J.E Lynch. 1970. Breeding bird populations of burned and unburned conifer forest in the Sierra Nevada. Condor 72:182-189. Covington, W.W., P.Z.Ful6, M.M. Moore, S.C. Hart, T.K. Kolb, J.N. Mast, S.S. Sackett, and M.R. Wagner. 1997. Restoring ecosystem health in ponderosa pine forests of the Southwest. Journal of Forestry 95:23-29. Cunningham, J.B., R.P. Balda, and W.G. Gaud. 1980. Selection and use of snags by secondary cavity-nesting birds of the ponderosa pine forest. Research Paper RM-122, U.S. Department of Agriculture, Forest Service, Rocky Mountain Forest and Range Experiment Station, Fort Collins, CO. Dunnett, C.W. 1980. Pairwise multiple comparisons in the unequal variance case. Journal of the American Statistical Association 75:796-800. DWYER AND BLOCK Horton, S.P, and R.W. Mannan. 1988. Effects of prescribed fire on snags and cavity-nesting birds in southeastern Arizona pine forests. Wildlife Society Bulletin 16:37-44. Johnson, T.H., and R.H. Wauer. 1996. Avifaunal response to the 1977 La Mesa fire. Pages 70-94 in C.D. Allen (technical coordinator). Proceedings of the second La Mesa fire symposium fire effects on southwestern forests. General Technical Report RM-286, U.S. Department of Agriculture, Forest Service, Rocky Mountain Forest and Range Experiment Station, Fort Collins, CO. Lowe, PO., PE Ffolliott, J.H. Dieterich, and D.R. Patton. 1978. Determining potential benefits from wildfire in Arizona ponderosa pine forests. General Technical Report RM-52, U S . Department of Agriculture, Forest Service, Rocky Mountain Forest and Range Experiment Station, Fort Collins, CO. Milliken, G.A., and D.E. Dallas. 1984. Analysis of messy data. Volume 1. Van Nostrand Reinhold, New York. Neter, J., M.H. Kutner, C.J. Nachtsheim, and W. Wasserman. 1996. Applied linear statistical models. Fourth edition. RIchard D. Irwin, Chicago. Petit, D.R., L.J. Petit, V.A. Saab, and T.E. Martin. 1995. Fixedradius point counts in forests: factors influencing effectiveness and efficiency. Pages 49-56 in C.J. Ralph, J.R. Sauer, and S. Droege (eds.). Monitoring bird populations by point counts. General Technical Report GTR-149, U S . Department of Agriculture, Forest Service, Pacific Southwest Research Station, Albany, CA. Sokal, R.R., and EJ. Rohlf. 1969. Biometry. W.H. Freeman, San Francisco. Szaro, R.C., J.D. Brawn, and R.P. Balda. 1990. Yearly variation in resource-use behavior by ponderosa pine forest birds. Studies in Avian Biology 13:226-235. Taylor, D.L., and W.J. Barmore. 1980. Post-fire succession of avifauna in coniferous forests of Yellowstone and Grand Teton National Parks, Wyoming. Pages 130-140 in R.M. Degraaf and N.G. Tilghman (technical coordinators). Proceedings of the workshop on management of western forests and grasslands for nongarne birds. General Technical Report INT-89, U.S. Department of Agriculture, Forest Service, Intermountain Forest and Range Experiment Station, Ogden, UT.
