Soil Monitoring using GPS Measuring “footprint” of HFQLG operations
advertisement
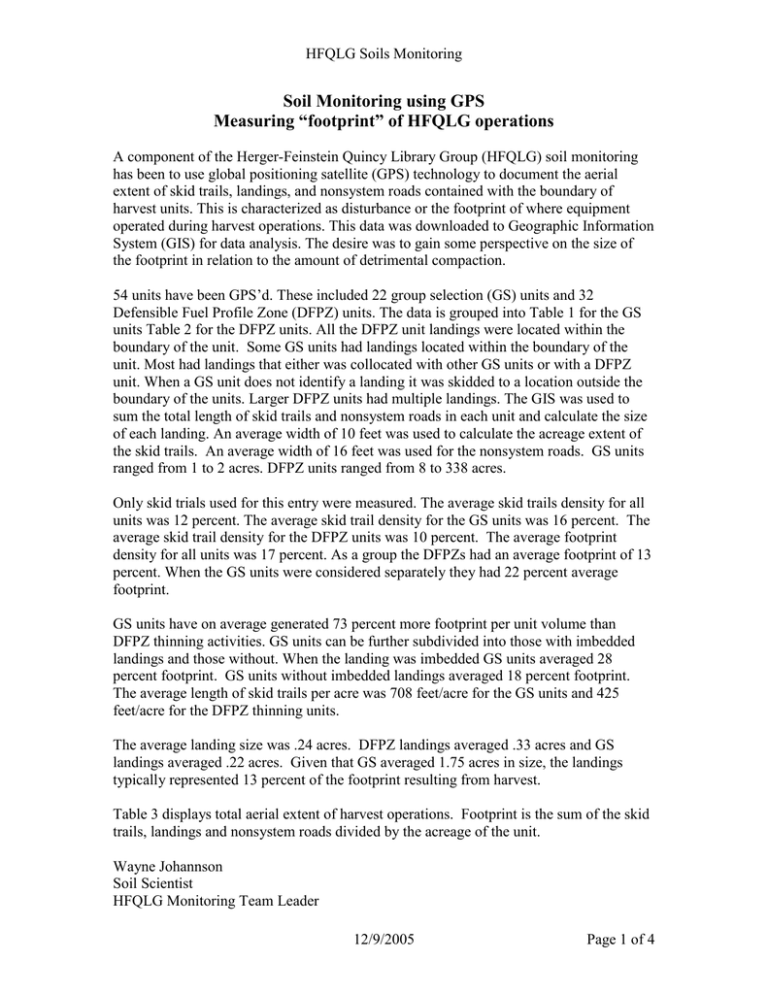
HFQLG Soils Monitoring Soil Monitoring using GPS Measuring “footprint” of HFQLG operations A component of the Herger-Feinstein Quincy Library Group (HFQLG) soil monitoring has been to use global positioning satellite (GPS) technology to document the aerial extent of skid trails, landings, and nonsystem roads contained with the boundary of harvest units. This is characterized as disturbance or the footprint of where equipment operated during harvest operations. This data was downloaded to Geographic Information System (GIS) for data analysis. The desire was to gain some perspective on the size of the footprint in relation to the amount of detrimental compaction. 54 units have been GPS’d. These included 22 group selection (GS) units and 32 Defensible Fuel Profile Zone (DFPZ) units. The data is grouped into Table 1 for the GS units Table 2 for the DFPZ units. All the DFPZ unit landings were located within the boundary of the unit. Some GS units had landings located within the boundary of the unit. Most had landings that either was collocated with other GS units or with a DFPZ unit. When a GS unit does not identify a landing it was skidded to a location outside the boundary of the units. Larger DFPZ units had multiple landings. The GIS was used to sum the total length of skid trails and nonsystem roads in each unit and calculate the size of each landing. An average width of 10 feet was used to calculate the acreage extent of the skid trails. An average width of 16 feet was used for the nonsystem roads. GS units ranged from 1 to 2 acres. DFPZ units ranged from 8 to 338 acres. Only skid trials used for this entry were measured. The average skid trails density for all units was 12 percent. The average skid trail density for the GS units was 16 percent. The average skid trail density for the DFPZ units was 10 percent. The average footprint density for all units was 17 percent. As a group the DFPZs had an average footprint of 13 percent. When the GS units were considered separately they had 22 percent average footprint. GS units have on average generated 73 percent more footprint per unit volume than DFPZ thinning activities. GS units can be further subdivided into those with imbedded landings and those without. When the landing was imbedded GS units averaged 28 percent footprint. GS units without imbedded landings averaged 18 percent footprint. The average length of skid trails per acre was 708 feet/acre for the GS units and 425 feet/acre for the DFPZ thinning units. The average landing size was .24 acres. DFPZ landings averaged .33 acres and GS landings averaged .22 acres. Given that GS averaged 1.75 acres in size, the landings typically represented 13 percent of the footprint resulting from harvest. Table 3 displays total aerial extent of harvest operations. Footprint is the sum of the skid trails, landings and nonsystem roads divided by the acreage of the unit. Wayne Johannson Soil Scientist HFQLG Monitoring Team Leader 12/9/2005 Page 1 of 4 HFQLG Soils Monitoring Table 1. GS units Length of Total Average Total length skid trail Landing Landing of skid trail per acre in size (ac) Size (ac) in feet feet Total Total skid trail Skid trail Non footprint footprint footprint as a Total foot system as a using 10' percent of print (ac) road (ac) percent of wide trail unit unit (ac) District Sale Unit Size (ac) Beckwourth Red Clover GS 2 20 1.7 0.35 0.35 859 505 0.2 12 - 0.55 32 Beckwourth Red Clover GS 2 30 1.6 0.33 0.33 1,441 900 0.33 20 - 0.66 41 Eagle Lake Peg GS 500 1.85 - - 1,417 766 0.33 18 - 0.33 18 Hat Creek Blacks Ridge GS 5 2 0.42 0.42 1,197 598 0.27 14 - 0.69 34 Hat Creek Blacks Ridge GS 8 2 - - 2,188 1,094 0.5 25 - 0.5 25 Hat Creek Blacks Ridge GS 237 2 - - 1,136 568 0.26 13 - 0.26 13 Mt Hough Deanes GS 273 2.02 0.04 0.04 1,387 687 0.32 16 0.02 0.38 19 Mt Hough Deanes GS 363 1.09 - - 1,038 952 0.24 22 - 0.24 22 Mt Hough Deanes GS 367 1.97 0.44 0.44 1,440 730 0.33 16 - 0.77 39 Mt Hough Deanes GS 376 1.82 0.06 0.06 853 469 0.19 11 - 0.25 14 Mt Hough Deanes GS 382 1.32 - - 1,043 790 0.24 18 - 0.24 18 Mt Hough Deanes GS 475 1.79 - - 1,844 1,030 0.42 24 - 0.42 23 Mt Hough Deanes GS 634 0.98 - - 1,137 1,160 0.26 27 - 0.26 26 Mt Hough Deanes GS 716 1.78 0.12 0.12 1,364 766 0.31 18 0.01 0.44 25 Mt Hough Deanes GS 717 1.7 0.13 0.13 1,456 856 0.33 20 0.01 0.47 28 Mt Hough Deanes GS 753 2.02 - - 1,605 794 0.37 18 - 0.37 18 Mt Hough Guard GS 383 2.02 - - 937 464 0.21 11 - 0.21 10 Mt Hough Guard GS 389 1.93 - - 748 388 0.17 9 - 0.17 9 Mt Hough Guard GS 477 1.83 0.08 0.08 542 296 0.12 7 0.17 0.37 20 Mt Hough Guard GS 746 1.67 - - 1,094 655 0.25 15 - 0.25 15 Mt Hough Guard GS 819 1.71 0.26 0.26 691 404 0.16 9 - 0.42 25 Mt Hough Guard GS 820 1.73 - - 1,203 695 0.28 16 - 0.28 16 Averages 0.22 12/9/2005 708 Page 2 of 4 16 22 HFQLG Soils Monitoring Table 2. DFPZ Units District Sale Unit Almanor Cherry Hill 133 34.9 0.39 0.2 16736 480 3.89 11 0.53 4.76 14 Beckwourth Last Chance 10 48.9 0.87 0.29 14,275 292 3.27 7 - 4.14 8 Beckwourth Last Chance 13 156 0.73 0.18 38,711 248 8.89 6 1.9 11.52 7 Beckwourth Last Chance 15 173 1.7 0.19 43,477 251 9.98 6 1 12.68 7 Beckwourth Last Chance 30 24 0.4 0.2 6,524 272 1.5 6 - 1.9 8 Beckwourth Last Chance 47 83.6 1.2 0.17 23,519 281 5.4 6 1.7 8.3 10 Beckwourth Red Clover 49 34.7 0.68 0.17 14,487 417 3.33 10 -- 4.01 12 Beckwourth Red Clover 54 56.85 0.88 0.29 21,374 376 4.91 9 -- 5.74 10 Eagle Lake 44 Hollow 112 51.7 2.5 0.5 33,766 653 7.75 15 1.7 11.95 23 Eagle Lake Bidwell 62 11 0.33 0.33 4,665 424 1.07 10 - 1.4 13 Eagle Lake Bidwell 127 120.5 2.2 0.44 48,745 405 11.19 9 - 13.39 11 Eagle Lake Bidwell 128 39 1.1 0.55 15,169 389 3.48 9 0.1 4.68 12 Eagle Lake Bridge 113 24.2 0.54 0.27 10,947 452 2.51 10 - 3.05 13 Eagle Lake Bridge 116 66.7 0.63 0.31 19,384 291 4.45 7 - 5.08 8 Eagle Lake Bridge 120 39.7 0.95 0.32 19,147 482 4.4 11 0.2 5.55 14 Hat Creek Pittville 30115 338 3.1 0.34 136,345 403 31.3 9 - 34.4 10 Mt Hough Antelope/Border 5 26.7 0.25 0.25 8,610 322 2.26 8 - 2.51 9 Total Size (ac) Landing size (ac) Average Length of skid Total skid trail Skid trail Total length of Nonsystem Landing trail per acre footprint using 10' footprint as a skid trail in feet road (ac) Size (ac) in feet wide trail (ac) percent of unit Total footprint Total foot as a percent of print (ac) unit Mt Hough Antelope/Border 8 57.8 1 0.2 31,441 544 7.22 12 1 9.22 16 Sierraville Jelly 177 14.8 0.29 0.29 7,777 525 1.79 12 - 2.08 14 Sierraville Leftover 160 42.9 0.96 0.48 18,595 433 4.27 10 0.42 5.65 13 Sierraville Leftover 182 51.1 1.1 0.55 25,825 505 5.93 11 0.42 7.45 15 Sierraville Marmalade 42 9.6 0.42 0.42 5,231 545 1.2 13 0.26 1.88 20 Sierraville Marmalade 44 30 0.29 0.29 12,248 408 2.81 9 0.07 3.17 11 Sierraville Pieces 26 8 0.27 0.27 907 113 0.21 2 0.08 0.56 7 Sierraville Skippy 12 20 0.38 0.38 4,520 226 1.04 5 0.07 1.49 7 Sierraville Skippy 95 50.5 1.55 0.39 28,251 559 6.48 13 0.7 8.73 18 Sierraville Skippy 12B 31 0.41 0.41 13,487 435 3.1 10 0.08 3.59 12 Sierraville Toro 13 26 0.45 0.45 13,688 526 3.14 12 0.87 4.46 17 Sierraville Toro 14 17 0.61 0.3 10,532 619 2.42 14 0.3 3.33 20 Sierraville Toro 24 35 0.98 0.49 22,107 631 5.07 15 0.8 6.85 20 Sierraville Toro 26 33 0.94 0.45 20,161 611 4.63 14 0.35 5.92 18 Sierraville Toro 40 9.5 0.9 0.3 4,442 468 1.02 11 0.2 2.12 22 Averages 0.33 12/9/2005 425 Page 3 of 4 10 13 HFQLG Soils Monitoring Table 3. Total Aerial Extent of Disturbance 12/9/2005 Page 4 of 4
