1 Polymerase Chain Reaction (PCR)
advertisement
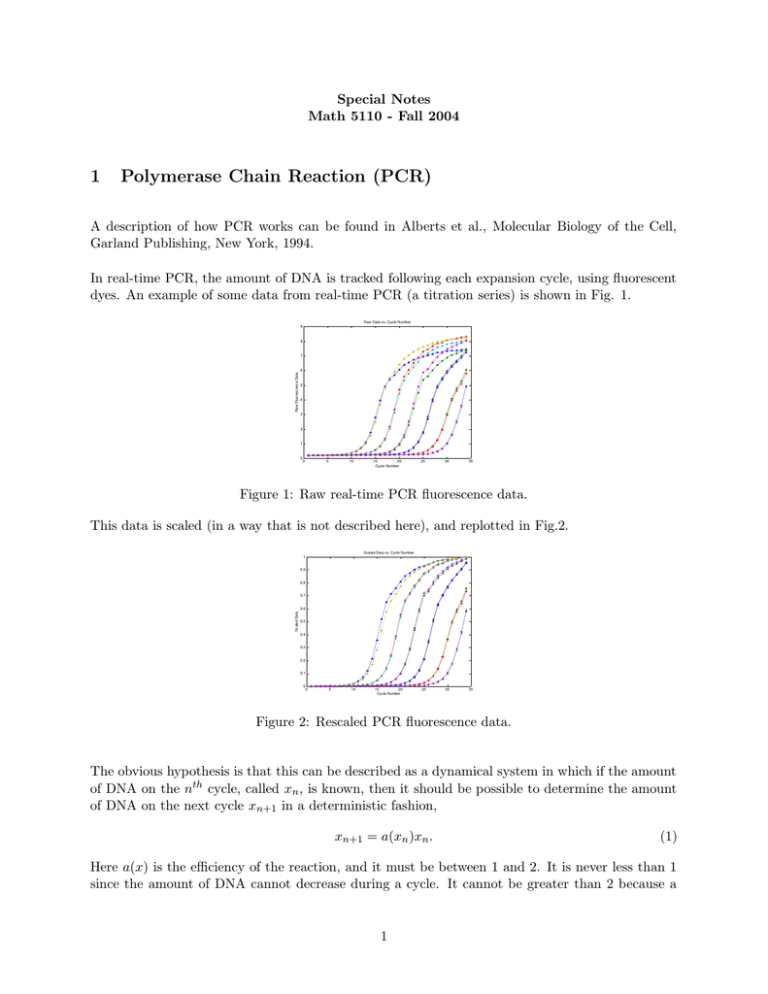
Special Notes Math 5110 - Fall 2004 1 Polymerase Chain Reaction (PCR) A description of how PCR works can be found in Alberts et al., Molecular Biology of the Cell, Garland Publishing, New York, 1994. In real-time PCR, the amount of DNA is tracked following each expansion cycle, using fluorescent dyes. An example of some data from real-time PCR (a titration series) is shown in Fig. 1. Raw Data vs. Cycle Number 9 8 Raw Fluorescence Data 7 6 5 4 3 2 1 0 0 5 10 15 20 Cycle Number 25 30 35 Figure 1: Raw real-time PCR fluorescence data. This data is scaled (in a way that is not described here), and replotted in Fig.2. Scaled Data vs. Cycle Number 1 0.9 0.8 0.7 Scaled Data 0.6 0.5 0.4 0.3 0.2 0.1 0 0 5 10 15 20 Cycle Number 25 30 35 Figure 2: Rescaled PCR fluorescence data. The obvious hypothesis is that this can be described as a dynamical system in which if the amount of DNA on the nth cycle, called xn , is known, then it should be possible to determine the amount of DNA on the next cycle xn+1 in a deterministic fashion, xn+1 = a(xn )xn . (1) Here a(x) is the efficiency of the reaction, and it must be between 1 and 2. It is never less than 1 since the amount of DNA cannot decrease during a cycle. It cannot be greater than 2 because a 1 Data plotted as iterates 1 0.9 0.8 0.7 x n+1 0.6 0.5 0.4 0.3 0.2 0.1 0 0 0.1 0.2 0.3 0.4 0.5 x 0.6 0.7 0.8 0.9 1 n Figure 3: Rescaled PCR data plotted as x n+1 vs. xn . cycle can never do any better than duplicate the DNA. To see if this hypothesis makes sense, we plot the data as xn+1 against xn in Fig. 3. A curve was fit to this data and it is shown in Fig. 4. Rescaled Data plotted as Iteration 1 0.9 0.8 0.7 X n+1 0.6 0.5 0.4 0.3 0.2 0.1 0 0 0.1 0.2 0.3 0.4 0.5 X 0.6 0.7 0.8 0.9 1 n Figure 4: The curve a(x)x shown compared with data. The efficiency of the reaction can be obtained by plotting a(x) or are shown in Fig. 5. xn+1 xn as a function of xn . These Reaction Efficiency 2 1.9 1.8 1.7 1.5 x /x n+1 n 1.6 1.4 1.3 1.2 1.1 1 0 0.1 0.2 0.3 0.4 0.5 x 0.6 0.7 0.8 0.9 1 n Figure 5: Reaction efficiency. Now the problem of quantification can be easily solved. The goal of quantification is to determine the initial amount of DNA in an unknown sample. If the amplification data are known, it is a simple matter to find the value x0 whose iterates xn+1 = a(xn )xn give the best fit to the data. 2

