R Programming Assignment: Introduction to R
advertisement

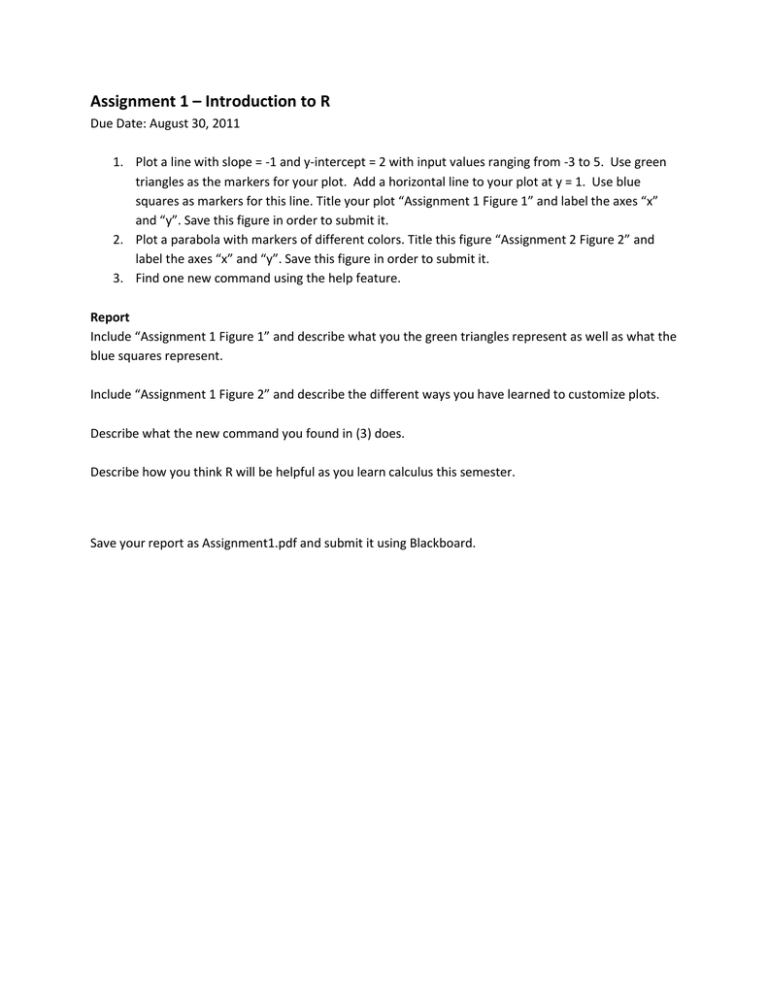
Assignment 1 – Introduction to R Due Date: August 30, 2011 1. Plot a line with slope = -1 and y-intercept = 2 with input values ranging from -3 to 5. Use green triangles as the markers for your plot. Add a horizontal line to your plot at y = 1. Use blue squares as markers for this line. Title your plot “Assignment 1 Figure 1” and label the axes “x” and “y”. Save this figure in order to submit it. 2. Plot a parabola with markers of different colors. Title this figure “Assignment 2 Figure 2” and label the axes “x” and “y”. Save this figure in order to submit it. 3. Find one new command using the help feature. Report Include “Assignment 1 Figure 1” and describe what you the green triangles represent as well as what the blue squares represent. Include “Assignment 1 Figure 2” and describe the different ways you have learned to customize plots. Describe what the new command you found in (3) does. Describe how you think R will be helpful as you learn calculus this semester. Save your report as Assignment1.pdf and submit it using Blackboard.


