Indicator 7.
advertisement

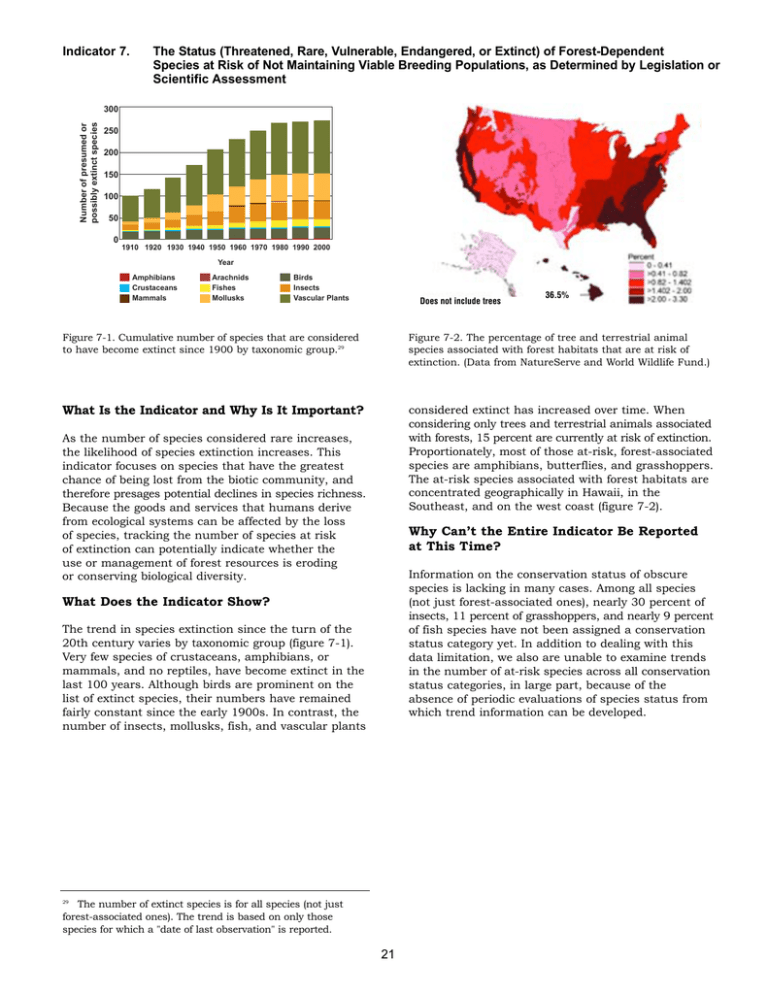
Indicator 7. The Status (Threatened, Rare, Vulnerable, Endangered, or Extinct) of Forest-Dependent Species at Risk of Not Maintaining Viable Breeding Populations, as Determined by Legislation or Scientific Assessment Number of presumed or possibly extinct species 300 250 200 150 100 50 0 1910 1920 1930 1940 1950 1960 1970 1980 1990 2000 Year Amphibians Crustaceans Mammals Arachnids Fishes Mollusks Birds Insects Vascular Plants Does not include trees 36.5% Figure 7-1. Cumulative number of species that are considered to have become extinct since 1900 by taxonomic group.29 Figure 7-2. The percentage of tree and terrestrial animal species associated with forest habitats that are at risk of extinction. (Data from NatureServe and World Wildlife Fund.) What Is the Indicator and Why Is It Important? considered extinct has increased over time. When considering only trees and terrestrial animals associated with forests, 15 percent are currently at risk of extinction. Proportionately, most of those at-risk, forest-associated species are amphibians, butterflies, and grasshoppers. The at-risk species associated with forest habitats are concentrated geographically in Hawaii, in the Southeast, and on the west coast (figure 7-2). As the number of species considered rare increases, the likelihood of species extinction increases. This indicator focuses on species that have the greatest chance of being lost from the biotic community, and therefore presages potential declines in species richness. Because the goods and services that humans derive from ecological systems can be affected by the loss of species, tracking the number of species at risk of extinction can potentially indicate whether the use or management of forest resources is eroding or conserving biological diversity. Why Can’t the Entire Indicator Be Reported at This Time? Information on the conservation status of obscure species is lacking in many cases. Among all species (not just forest-associated ones), nearly 30 percent of insects, 11 percent of grasshoppers, and nearly 9 percent of fish species have not been assigned a conservation status category yet. In addition to dealing with this data limitation, we also are unable to examine trends in the number of at-risk species across all conservation status categories, in large part, because of the absence of periodic evaluations of species status from which trend information can be developed. What Does the Indicator Show? The trend in species extinction since the turn of the 20th century varies by taxonomic group (figure 7-1). Very few species of crustaceans, amphibians, or mammals, and no reptiles, have become extinct in the last 100 years. Although birds are prominent on the list of extinct species, their numbers have remained fairly constant since the early 1900s. In contrast, the number of insects, mollusks, fish, and vascular plants 29 The number of extinct species is for all species (not just forest-associated ones). The trend is based on only those species for which a "date of last observation" is reported. 21


