x } = {10, 9.7, 6.8, 8.8, 10.2, 10.5, 11} determine...
advertisement
1. Given a list of scores {xi } = {10, 9.7, 6.8, 8.8, 10.2, 10.5, 11} determine the height of the probability historgram for the class
interval [10, 10.5). Show your method and evaluate (plug in) but do not reduce.
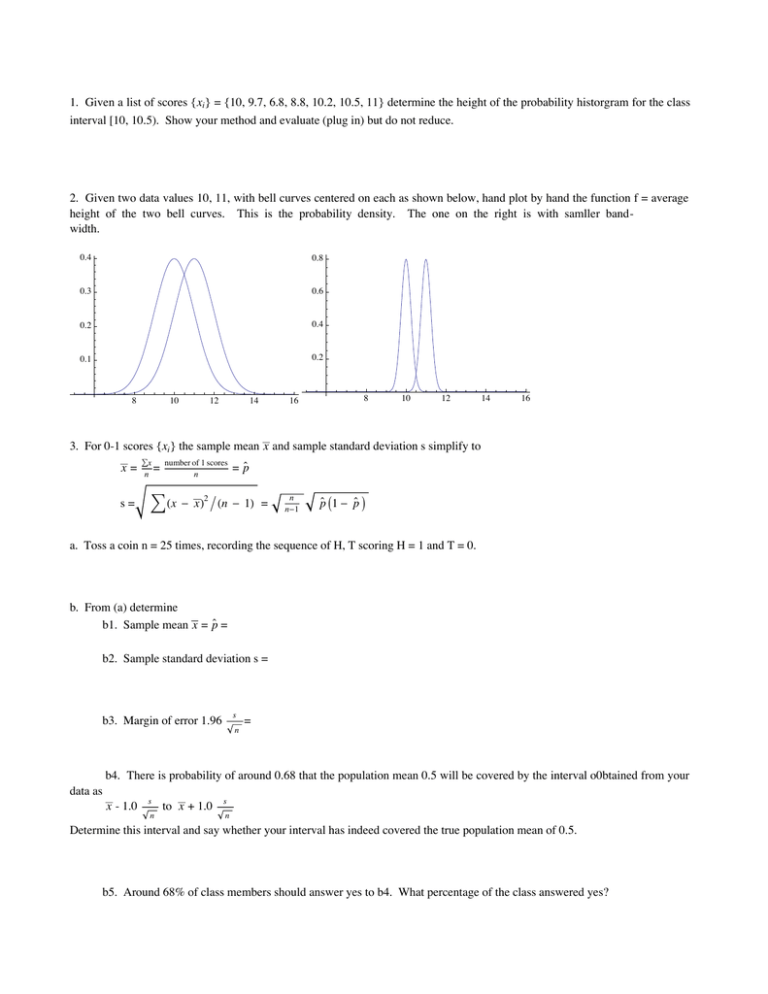
2. Given two data values 10, 11, with bell curves centered on each as shown below, hand plot by hand the function f = average
height of the two bell curves. This is the probability density. The one on the right is with samller bandwidth.
0.4
0.8
0.3
0.6
0.2
0.4
0.1
0.2
8
10
12
14
16
8
10
12
14
16
3. For 0-1 scores {xi } the sample mean x and sample standard deviation s simplify to
`
⁄x
number of 1 scores
x= n=
=p
n
s=
2
‚ Hx - xL ë Hn - 1L =
n
n-1
`
`
p I1 - p M
a. Toss a coin n = 25 times, recording the sequence of H, T scoring H = 1 and T = 0.
b. From (a) determine
`
b1. Sample mean x = p =
b2. Sample standard deviation s =
s
b3. Margin of error 1.96
n
=
b4. There is probability of around 0.68 that the population mean 0.5 will be covered by the interval o0btained from your
data as
x - 1.0
s
n
to x + 1.0
s
n
Determine this interval and say whether your interval has indeed covered the true population mean of 0.5.
b5. Around 68% of class members should answer yes to b4. What percentage of the class answered yes?


