INFLUENCE OF LOCAL INCIDENCE ANGLE EFFECTS ON GROUND COVER ESTIMATES
advertisement

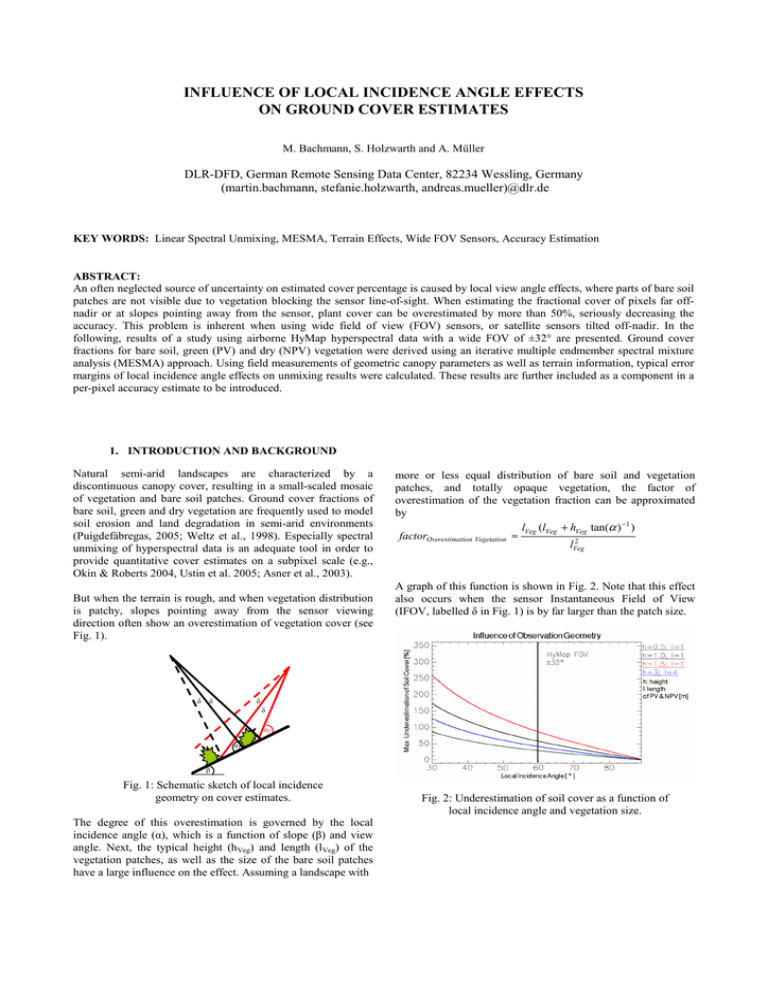
INFLUENCE OF LOCAL INCIDENCE ANGLE EFFECTS ON GROUND COVER ESTIMATES M. Bachmann, S. Holzwarth and A. Müller DLR-DFD, German Remote Sensing Data Center, 82234 Wessling, Germany (martin.bachmann, stefanie.holzwarth, andreas.mueller)@dlr.de KEY WORDS: Linear Spectral Unmixing, MESMA, Terrain Effects, Wide FOV Sensors, Accuracy Estimation ABSTRACT: An often neglected source of uncertainty on estimated cover percentage is caused by local view angle effects, where parts of bare soil patches are not visible due to vegetation blocking the sensor line-of-sight. When estimating the fractional cover of pixels far offnadir or at slopes pointing away from the sensor, plant cover can be overestimated by more than 50%, seriously decreasing the accuracy. This problem is inherent when using wide field of view (FOV) sensors, or satellite sensors tilted off-nadir. In the following, results of a study using airborne HyMap hyperspectral data with a wide FOV of ±32° are presented. Ground cover fractions for bare soil, green (PV) and dry (NPV) vegetation were derived using an iterative multiple endmember spectral mixture analysis (MESMA) approach. Using field measurements of geometric canopy parameters as well as terrain information, typical error margins of local incidence angle effects on unmixing results were calculated. These results are further included as a component in a per-pixel accuracy estimate to be introduced. 1. INTRODUCTION AND BACKGROUND Natural semi-arid landscapes are characterized by a discontinuous canopy cover, resulting in a small-scaled mosaic of vegetation and bare soil patches. Ground cover fractions of bare soil, green and dry vegetation are frequently used to model soil erosion and land degradation in semi-arid environments (Puigdefábregas, 2005; Weltz et al., 1998). Especially spectral unmixing of hyperspectral data is an adequate tool in order to provide quantitative cover estimates on a subpixel scale (e.g., Okin & Roberts 2004, Ustin et al. 2005; Asner et al., 2003). But when the terrain is rough, and when vegetation distribution is patchy, slopes pointing away from the sensor viewing direction often show an overestimation of vegetation cover (see Fig. 1). δ δ more or less equal distribution of bare soil and vegetation patches, and totally opaque vegetation, the factor of overestimation of the vegetation fraction can be approximated by lVeg (lVeg + hVeg tan(α ) −1 ) factorOverestimation Vegetation ≈ 2 lVeg A graph of this function is shown in Fig. 2. Note that this effect also occurs when the sensor Instantaneous Field of View (IFOV, labelled δ in Fig. 1) is by far larger than the patch size. δ δ α2 α1 β Fig. 1: Schematic sketch of local incidence geometry on cover estimates. The degree of this overestimation is governed by the local incidence angle (α), which is a function of slope (β) and view angle. Next, the typical height (hVeg) and length (lVeg) of the vegetation patches, as well as the size of the bare soil patches have a large influence on the effect. Assuming a landscape with Fig. 2: Underestimation of soil cover as a function of local incidence angle and vegetation size. 2. DATABASE AND PRE-PROCESSING As a test area, the Cabo de Gata natural park in south-eastern Spain is used. The terrain is rough, ranging from sea level up to 500m asl. All imagery used in this study was acquired by HyMap, an airborne whiskbroom imaging spectrometer covering the spectral range between 450 and 2500 nm with an average bandwidth of ~16nm in 128 bands (Cocks et al., 1998). The instantaneous field of view is 2.5 mrad along and 2.0 mrad across track and the total field of view is 61.3 degrees, resulting in 512 image pixels per scanline. Flight campaigns were carried out in 2003, twice in 2004, and in 2005. A total of 21 HyMap datasets was acquired, covering large areas of the natural park 'Cabo de Gata' (Bachmann et al., 2004). The subset used in this study is depicted in Fig. 3 below. Cabo de Gata 2005, FL1 (Subset) CIR Composite Geographic Datum: European 1950 mean Gridline distance: 625m Altitude a.s.l. [m] Fig. 3: Left: Subset of HyMap flightline used in this study. Right: corresponding DEM Pre-processing including atmospheric and geometric correction was carried out for the selected scenes. The raw HyMap data is system corrected to at-sensor-radiance based on calibration coefficients obtained during laboratory calibration by HyVista. Afterwards geocoding and atmospheric correction are carried out as part of the standard processing chain for hyperspectral data at DLR (Habermeyer et al., 2005). The imagery was first geocoded using ORTHO (Müller et al., 2005). This automated software package is based on a parametric approach determining the viewing geometry for each pixel based on sensor-specific parameters, flight parameters such as sensor position and attitude (i.e. roll, pitch, true heading), and additional terrain information from a digital terrain model (DEM). For the atmospheric correction, ATCOR4 was used (Richter & Schläpfer, 2002). This physically based approach, using the MODTRAN radiative transfer code, corrects for atmospheric effects as well as adjacency scattering, and BRDF compensation in order to derive nadir-normalized ground reflectance. Furthermore topographic correction for different terrain illumination is applied. To ensure a good quality of all input data, the radiometric and geometric accuracy was assessed. Based on ground control points, geocoding resulted in a data set with an RMS error in position better than 3 pixels. For the quality assessment of preprocessed HyMap data, radiometric and spectral accuracy was evaluated for the Cabo de Gata dataset. Field campaigns were carried out in 2003 and 2004 in close cooperation with GeoForschungsZentrum Potsdam (GFZ) and University of Almeria, where spectral measurements were taken in the field in order to provide ground reference data for analysis. Mean image spectra of a gravel site and other calibration targets were within one standard deviation of the corresponding ground measurements. 3. ESTIMATION OF GROUND COVER FRACTIONS USING LINEAR UNMIXING 3.1 µMESMA – an iterative multiple endmember spectral mixture analysis approach For the estimation of ground cover fractions, an automated iterative multiple endmember spectral mixture analysis approach (denoted µMESMA) is applied. The main advantage of a MESMA approach over standard unmixing is the incorporation of a large number of endmember (EM) and thus the explicit inclusion of EM spectral variability (e.g. Asner et al., 2000; Roberts et al., 1998; Garcia-Haro et al., 2005). Also the problem with linear dependencies between EM and consequently ill-conditioned models is reduced since only one EM for the classes PV, NPV and soil is used simultaneously. While other MESMA approaches select the EM-model with the lowest unmixing RMS, the µMESMA approach uses a combined model selection criteria (see Bachmann et al., 2004; Bachmann et al., 2005 for a closer description). First of all, a residual analysis is conducted; therefore spectral features in the residual spectra are detected and identified using a knowledgebased approach. If the residual spectra of a mixture model shows an identifiable signal above noise level (e.g. an overestimation of clay absorbance at 2.20 µm), it is likely that an unsuitable EM is used (i.e. a soil EM with too high clay content). Thus the calculated EM fractions are also likely to be incorrect. Consequently this mixture model is assigned a low confidential score, which will be combined with the modelling RMS error. The RMS in the SWIR2 is included with a higher weighting factor since this wavelength range is of particular interest for the separation of PV, NPV and soil due to the diagnostic absorption features of clay and lignocellulose (e.g. ASNER). Finally the mixture model with the highest confidential score is selected. The µMESMA approach also includes an iterative selection of EMs based on the residual analysis in order to avoid a timeconsuming ‘brute-force’ unmixing. Additional improvements comprise the incorporation of spatial neighbourhood information into the unmixing process, filtering and preprocessing of spectra, and the exclusion of mixture models with linear dependency and thus ill-conditioned EM models. Data products include quantitative cover estimates for PV, NPV and soil. For each pixel, a reliability estimation is computed based on residual features, unmixing RMS and on comparison with empirical regressions. Also the local incidence angle is explicitly included as one part of the reliability estimate. 3.2 Endmember Selection In the framework of µMESMA, scene EM are automatically derived using two approaches. First, Sequential Maximum Angle Convex Cone (SMACC, see Gruninger at al., 2004) is applied in order to detect spectrally extreme pixels in the image. To improve results, erroneous spectra (saturated and / or noisy) as well as classes which are not of interest (e.g., water) are previously masked out. All proposed EM by SMACC are then classified using a feature-based approach. The final EM spectra for PV, NPV and soil are then selected using the criteria for MESMA EM by Dennison & Roberts (2003), plus the addition of spectral similarity tests. After the first unmixing iteration, pixels with a high modelling error are automatically tested if they are potential additional EM. Thus the same steps for proposed EM as for SMACC are carried out. It has to be noted that even though the whole approach is fully automatic, a manual inspection of the proposed EM is highly recommended to ensure that only appropriate EM spectra (i.e. no mixtures, only classes of interest) are used. 3.3 Typical Accuracy The typical accuracy of the µMESMA approach is listed in Table 1. The data base used for the error assessment includes spectral simulations as well as comparison with ground cover measurements taken in the field (Bachmann et al., 2005). PV NPV Soil 4.2 Results When comparing the typical spectra of south-oriented slopes with north-oriented, the increased soil proportion is clearly visible in the spectra of southern slopes (Fig. 4 & 5). Absorption features caused by iron are visible at 0.9 µm, as well as clay absorption at 2.2 µm while the holo-cellulose absorption at 2.09 µm is reduced. The overall albedo is similar in both cases due to the terrain correction and due to the similar spectral behaviour of dry vegetation and soil. For east- and westorientated slopes mean spectra are highly similar, showing the typical properties of mixed spectra. Thus the same type and composition of vegetation on east- and west-facing slopes can be expected also from a ‘spectral’ point of view. Table 1: Typical Error Margins of µMESMA Minimum R2 Error Mean (*) (**) Error <3% (***) Error 9.1 6.9 0.88 50% 10.1 5.5 0.73 46% 6.1 4.6 0.80 59% (*) : Error margin in abundance absolute based on different test scenarios : Error margin without errors caused by EM selection (***) : Percentage of models with abundance errors below 3% (**) The sources of error are mainly due to EM variability, and due to the high spectral similarity of classes green vegetation, dry vegetation and soil. The influence of flight orientation (and thus implicitly BRDF effects) were also addressed; in these experiments the correspondence of cover estimates in E-W & N-S orientated flightlines is typically within 4% abundance absolute in flat terrain. 4. TEST METHODOLOGY FOR LOCAL INCIDENCE ANGLE EFFECTS 4.1 Approach and Assumptions In order to address the influence of the local incidence angle on ground cover estimates, cover fractions on both sides of northsouth orientated ridges towards the sides of a north-south orientated flightline were analysed. Fig. 4: Typical spectra of north- and south-facing slopes (area average). Fig. 5: Typical spectra of slopes pointing away and towards the sensor (area average). When analysing the derived ground cover fractions, the proportion of soil on slopes pointing towards the sensor is generally higher than on slopes with a small local view angle (i.e. pointing away from the sensor). Ground cover is derived for PV, NPV and soil using the described µMESMA approach. Additional field estimates of typical canopy height and patch size are used to estimate the theoretical underestimation of soil cover. Under the assumption that vegetation density is approximately equal on east- and west-facing slopes, systematic differences in canopy cover should be caused by the described local incidence angle effects when these slopes are located off-nadir in a northsouth orientated flightline. For comparison, south- and northfacing slopes close to nadir of the flightlines were also investigated. Differences in ground cover on these slopes should be due to natural vegetation density on drier sunlit and more humid shaded slopes. Close to nadir only marginal local incidence angle effects should occur. In order to address these effects, it is highly important to reduce the influence of illumination and BRDF effects as described earlier. Fig. 6: Local incidence angle for test subset. Soil Ground Cover [%] Fig. 9: Reliability index for unmixing results. Fig. 7: Soil cover fractions derived by spectral unmixing. The black line in the inlay graph indicates the ridge location. In the following, results for a north-south oriented ridge at the extreme side of one flightline are presented (Fig. 6 & 7). While for flat terrain measurements would be taken at a local incidence angle of 62°, angles above 80° occur at slopes pointing towards the sensor, and angles between 35-50° on slopes pointing away from the sensor. When comparing the ground cover fractions for these slopes, the soil fraction is typically larger on slopes pointing towards the sensor by absolute ~10% cover when compared to the neighbouring slopes pointing away (Fig. 7 & 8). As also depicted, cover estimates for PV and NPV are increased by up to 8% absolute. Fig. 8: Plots of typical ground cover fractions (area average) located on the sides of the ridge (see Fig. 6 & 7). Since vegetation is not totally opaque as assumed in Fig. 2, the underestimation of soil fraction is less than predicted. But an underestimation for the whole area by approx. 20% seriously decreases the unmixing accuracy. Thus the results for such extreme slopes should be treated with care. Consequently this additional local uncertainty is explicitly addressed in a reliability measure, depicted in Fig. 9. This measure is based on a weighted modelling RMS, features of the unmxing residuum, derivation from expectation values using empirical regression models, and the local incidence angle. 5. CONCLUSIONS Local incidence angle effects significantly affect the accuracy of ground cover estimates for all measurements off-nadir when terrain is rough and when vegetation is patchy. When the line of sight from bare soil patches to the sensor is (partially) blocked by vegetation, the cover percentage of bare soil is underestimated while fractional cover by vegetation is overestimated. For the presented test case in semi-arid grasslands, an overestimation of vegetation cover of up to 20% (i.e. 10% abundance absolute) in rough terrain was observed due to the described effect. For comparison, the typical error margins of the MESMA unmixing approach are better than 8.5% abundance absolute, and in about half of all cases better than 3% abundance absolute. When comparing these figures, the accuracy of retrieved vegetation and soil cover is significantly reduced by local incidence angle effects. Even though the effect is less prominent on gentle terrain and near nadir, the accuracy of all ground cover estimates by all wide FOV sensors is affected. Since no physical correction of this effect is possible, it is reasonable to estimate the factor of overestimation based on the local relief and average vegetation height and size, and to include this in a per pixel reliability measure. By explicitly addressing this error, all following analysis methods requiring soil cover fractions (e.g. used for modelling soil erosion or land degradation) can incorporate this uncertainty. REFERENCES ASNER, G.P.; LOBELL, D.B. (2000): A Biogeophysical Approach for Automated SWIR Unmixing of Soils and Vegetation. In: Remote Sensing of Environment 74, pp. 99-112. ASNER, G.P.; BORGHI, C.E.; OJEDA, R. (2003): Desertification in Central Argentina: Changes in Ecosystem Carbon and Nitrogen from Imaging Spectroscopy. In: Ecological Applications 13(3), pp. 629—648. BACHMANN, M., MÜLLER, A., HABERMEYER, M., DECH, S. (2004): An Iterative Unmixing Approach in Support of Fractional Cover Estimation in Semi-Arid Environments. In: Proc. of SPIE Remote Sensing Europe, 13-16 September, Masplomas. BACHMANN, M., MÜLLER, A., HABERMEYER, M., SCHMIDT, M., DECH, S. (2005): Iterative Mesma Unmixing for Fractional Cover Estimates - Evaluating the Portability. In: Proc. 4th EARSeL Workshop on Imaging Spectroscopy, 27-29 April, Warsaw. COCKS, T., JENSSEN, T., STEWARD, A., WILSON, I., SCHIELDS, T. (1998): The HyMap Airborne Hyperspectral Sensor: the System, Calibration, and Performance. In: Proceedings of the First EARSeL Workshop on Imaging Spectroscopy, Zürich. DENNISON, P.E., ROBERTS, D.A. (2003): Endmember Selection for Multiple Endmember Spectral Mixture Analysis Using Endmember Average RMSE. In: Remote Sensing of Environment 87, pp. 123–135. GARCÍA-HARO, F.; SOMMER, S.; KEMPER, T.(2005): A New Tool for Variable Multiple Endmember Spectral Mixture Analysis (VMESMA). In: International Journal of Remote Sensing 26(10), pp. 2135-2162. GRUNINGER, J.; RATKOWSKI A.J.; HOKE, M. L. (2004): The Sequential Maximum Angle Convex Cone (SMACC) Endmember Model. In: Proceedings SPIE, Algorithms for Multispectral and Hyper-spectral and Ultraspectral Imagery Vol. 5425-1. HABERMEYER, M.; MUELLER, A.; HOLZWARTH, S.; RICHTER, R.; MUELLER, R.; BACHMANN, M.; SEITZ, K.H.; SEIFERT, P.; STROBL, P. (2005): Implementation of the Automatic Processing Chain for ARES. In: Proceedings of the 4thEARSeL Workshop on Imaging Spectroscopy. Warsaw. MÜLLER, R.; HOLZWARTH, S.; HABERMEYER, M.; MÜLLER, A. (2005): Ortho Image Production within an Automatic Processing Chain for Hyperspectral Airborne Scanner ARES. In: Proceedings of EARSeLWorkshop 3DRemote Sensing, Porto. OKIN, G.S.; ROBERTS, D.A. (2004): Manual of Remote Sensing – Remote Sensing for Natural Resource Management and Environmental Monitoring. Vol. 4: Remote Sensing in Arid Regions: Challenges and Opportunities, pp. 111-146, John Wiley and Sons, New York. PUIGDEFÁBREGAS, J. (2005): The Role of Vegetation Patterns in Structuring Runoff and Sediment Fluxes in Drylands. In: Earth Surface Processes and Landforms 30, pp. 133-147. RICHTER, R., SCHLÄPFER, D. (2002): Geo-Atmospheric Processing of Airborne Imaging Spectrometry Data, Part 2: Atmospheric / Topographic Correction. International Journal of Remote Sensing 23(13), pp. 2631-2649 ROBERTS, D.A.; GARDNER, M.; CHURCH, R.; USTIN, S.; SCHEER, G.; GREEN, R.O. (1998): Mapping Chaparral in the Santa Monica Mountains Using Multiple Endmember Spectral Mixture Models. In: Remote Sensing of Environment 65, pp. 267- 279. USTIN, S.L.; JACQUEMOUD, S.; PALACIOS-ORUETA, A.; LI, L.; WHITING, M.L. (2005): Remote Sensing Based Assessment of Biophysical Indicators for Land Degradation and Desertification. In: Proceedings of the 1st International Conference on Remote Sensing and Geoinformation Processing in the Assessment and Monitoring of Land Degradation and Desertification, Trier. WELTZ, M.A.; KIDWELL, M.R.; FOX, H.D. (1998): Influence of Abiotic and Biotic Factors in Measuring and Modeling Soil Erosion on Rangelands: State of Knowledge. In: J. Range Management 51, pp. 482-495.


