PRODUCTS DERIVED FROM AN ADVANCED DINSAR-GIS APPLICATION FOR RISK MANAGEMENT
advertisement
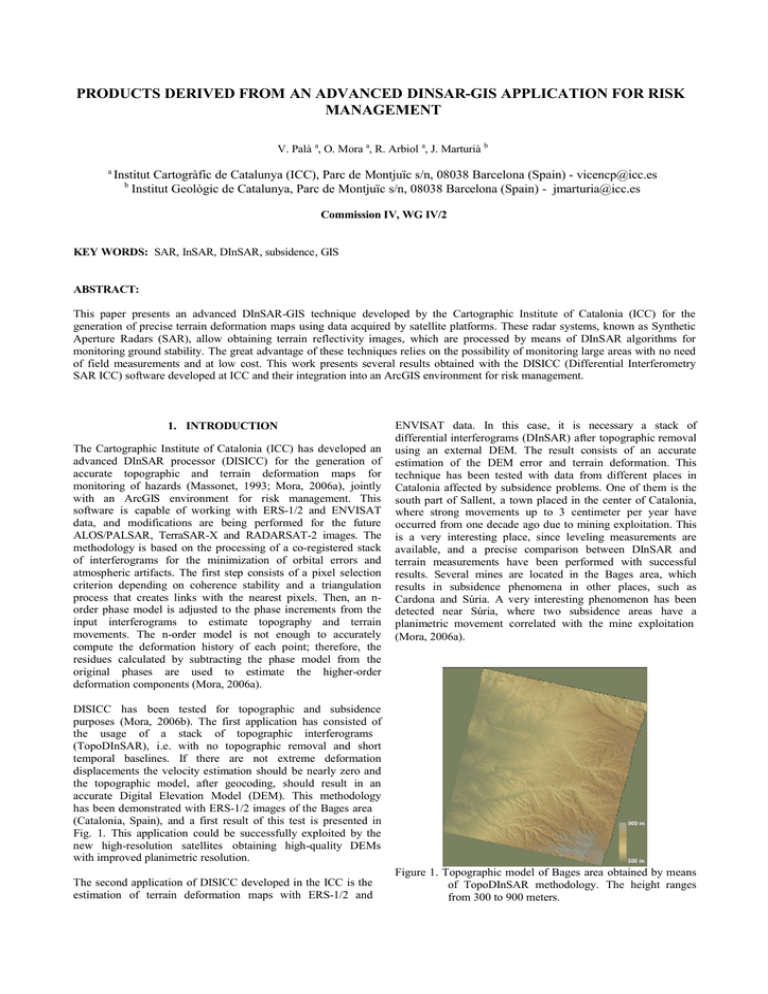
PRODUCTS DERIVED FROM AN ADVANCED DINSAR-GIS APPLICATION FOR RISK MANAGEMENT V. Palà a, O. Mora a, R. Arbiol a, J. Marturià b a Institut Cartogràfic de Catalunya (ICC), Parc de Montjuïc s/n, 08038 Barcelona (Spain) - vicencp@icc.es b Institut Geològic de Catalunya, Parc de Montjuïc s/n, 08038 Barcelona (Spain) - jmarturia@icc.es Commission IV, WG IV/2 KEY WORDS: SAR, InSAR, DInSAR, subsidence, GIS ABSTRACT: This paper presents an advanced DInSAR-GIS technique developed by the Cartographic Institute of Catalonia (ICC) for the generation of precise terrain deformation maps using data acquired by satellite platforms. These radar systems, known as Synthetic Aperture Radars (SAR), allow obtaining terrain reflectivity images, which are processed by means of DInSAR algorithms for monitoring ground stability. The great advantage of these techniques relies on the possibility of monitoring large areas with no need of field measurements and at low cost. This work presents several results obtained with the DISICC (Differential Interferometry SAR ICC) software developed at ICC and their integration into an ArcGIS environment for risk management. 1. INTRODUCTION The Cartographic Institute of Catalonia (ICC) has developed an advanced DInSAR processor (DISICC) for the generation of accurate topographic and terrain deformation maps for monitoring of hazards (Massonet, 1993; Mora, 2006a), jointly with an ArcGIS environment for risk management. This software is capable of working with ERS-1/2 and ENVISAT data, and modifications are being performed for the future ALOS/PALSAR, TerraSAR-X and RADARSAT-2 images. The methodology is based on the processing of a co-registered stack of interferograms for the minimization of orbital errors and atmospheric artifacts. The first step consists of a pixel selection criterion depending on coherence stability and a triangulation process that creates links with the nearest pixels. Then, an norder phase model is adjusted to the phase increments from the input interferograms to estimate topography and terrain movements. The n-order model is not enough to accurately compute the deformation history of each point; therefore, the residues calculated by subtracting the phase model from the original phases are used to estimate the higher-order deformation components (Mora, 2006a). ENVISAT data. In this case, it is necessary a stack of differential interferograms (DInSAR) after topographic removal using an external DEM. The result consists of an accurate estimation of the DEM error and terrain deformation. This technique has been tested with data from different places in Catalonia affected by subsidence problems. One of them is the south part of Sallent, a town placed in the center of Catalonia, where strong movements up to 3 centimeter per year have occurred from one decade ago due to mining exploitation. This is a very interesting place, since leveling measurements are available, and a precise comparison between DInSAR and terrain measurements have been performed with successful results. Several mines are located in the Bages area, which results in subsidence phenomena in other places, such as Cardona and Súria. A very interesting phenomenon has been detected near Súria, where two subsidence areas have a planimetric movement correlated with the mine exploitation (Mora, 2006a). DISICC has been tested for topographic and subsidence purposes (Mora, 2006b). The first application has consisted of the usage of a stack of topographic interferograms (TopoDInSAR), i.e. with no topographic removal and short temporal baselines. If there are not extreme deformation displacements the velocity estimation should be nearly zero and the topographic model, after geocoding, should result in an accurate Digital Elevation Model (DEM). This methodology has been demonstrated with ERS-1/2 images of the Bages area (Catalonia, Spain), and a first result of this test is presented in Fig. 1. This application could be successfully exploited by the new high-resolution satellites obtaining high-quality DEMs with improved planimetric resolution. The second application of DISICC developed in the ICC is the estimation of terrain deformation maps with ERS-1/2 and Figure 1. Topographic model of Bages area obtained by means of TopoDInSAR methodology. The height ranges from 300 to 900 meters. The final step of the work has been the integration of these results into ArcGIS under the Interreg II RISCMASS project. The goal of this project is to create a complete GIS environment for risk management combining information provided by advanced DInSAR techniques, leveling campaigns and geophysical data of the area under study. A complete database has been generated using ortophotos, geophysical data and topographic and deformation maps derived from DInSAR techniques. Finally, all this information can be selected and processed in ArcGIS for the generation of risk information. classical DInSAR can be only applied with fast subsidences, such as earthquakes, where the temporal interval between SAR acquisitions can be very low and the deformation signal is much stronger than atmospheric artifacts and DEM errors. The DISICC software has been created to overcome these inherent limitations of classical DInSAR using a stack of interferometric pairs with SAR images acquired at different dates (Mora, 2003). The redundancy obtained with these data allows the minimization of the atmospheric artifacts and topographic errors. The main characteristics of the software developed at ICC are the following: 2. THE DISICC SOFTWARE DInSAR techniques consist of the combination of two SAR images of the same area acquired from slightly different positions, see Fig. 2. 1. The first step of the process consists of a selection of those pixels that present high levels of coherence (phase quality) during the temporal interval of SAR acquisitions. Those areas that preserve their electromagnetic behavior will be selected, such as urban, arid or rock zones. On the other hand, the pixels related with vegetated areas will be usually rejected due to their low coherence level. Note that when combining images with large temporal separation high coherence is only preserved on electromagnetically stable zones. 2. A triangulation process is carried out after pixel selection for relating neighboring points. The information is extracted from increments between adjacent points better than from a single pixel. An advantage of this processing is the minimization of atmospheric artifacts, since atmosphere is a low frequency signal in space. 3. A phase model depending on the number of interferograms is adjusted to data using the following minimization function: G = Figure 2. DInSAR acquisition scheme. 1 N N · ?exp j · Fdif - Fmodel ( )( ]e, v (3) )[ i =0 The result of this combination is a new image known as interferogram, whose phase component is formed by the following terms: FInt = FTopo + FMov + F Atm + FNoise (1) where FTopo is the term related with topography, FMov is the phase component of terrain deformation, FAtm is the noise component caused by different atmospheric conditions for both SAR acquisitions and FNoise is the thermal noise. Topography, atmospheric effects and thermal noise must be canceled or minimized to obtain precise measurements of terrain movement. When working with classical DInSAR interferograms (combination of two SAR images) the main problem is the presence of atmospheric artifacts, since there is no way to cancel them without a priori information. On the other hand, the term related with topography can be canceled using and external Digital Elevation Model (DEM) and the orbital parameters of the SAR acquisitions, considering no height errors on the DEM, see (2). Fdif = FErrorTopo + FMov + F Atm + FNoise (2) As conclusion, atmospheric artifacts and DEM errors will affect the measurement precision on the deformation. For this reason, 4. Fmodel is the differential interferometric phase model that depends on the temporal and spatial separation of SAR acquisitions that form each interferogram and N is the number of interferograms. 5. After minimizing the function in (3) we obtain the increment values of topographic error (e) and deformation velocity (v) that best fit the network created by the triangulation commented above. Then, an integration process is needed to get their absolute values for each point. 6. The next step consists of the subtraction of the estimated model from each interferogram. The result is a phase residue formed by the non-linear components of the terrain displacement that are not taken into account in the simplified model used in (3). 7. Finally, these residues must be re-ordered in time and added to the model for obtaining the complete description of the temporal evolution of the deformation. Using the algorithm described above precise estimations of terrain displacements can be performed due to the amount of information present in N interferograms. The greater the number of images, the better the result precision. Our experience processing these kind of data says that a standard deviation lower than 3 mm/year or 5mm in absolute deformation can be obtained with stack of images larger than 20. 3. SUBSIDENCE RESULTS In this section several results are presented for both classical and advanced DInSAR. The first example corresponds to the Al-hoceima (Morocco) earthquake that took place on February 24th 2004 with a magnitude Mw 6.5. For this case two ENVISAT images has been processed, acquired on December 10th 2003 and July 7th 2004. Figure 3 shows the deformation fringes related with the rupture caused by the earthquake. It is very clear the coast area affected by the stronger magnitude of the displacement. Note that each color cycle corresponds to 2.8 cm of terrain movement. The last example presented in this paper has been generated using advanced DInSAR techniques implemented in DISICC software. A stack of SAR images acquired at different dates from slightly different positions has been used. The area under study is Sallent, a town located in the center of Catalonia. An old mine is found in the south part of this area generating strong subsidence problems in a neighborhood. Figure 5 shows the subsidence map estimated with DISICC where the shape and magnitude of this deformation are clearly depicted. Note that those zones with no representation of color points correspond to low coherence areas that are not selected in the first step of the algorithm presented in the previous section. Figure 3. Interferometric phase pattern of the Al-hoceima earthquake (February 24th 2004, Mw 6.5). The second example corresponds to an area of Catalonia affected by mining exploitations. Figure 4 clearly shows three subsidence areas in the interferogram generated with images acquired at February 3rd 2005 and May 19th 2005. It is important to remark that in this case several deformation phase fringes, again 2.8 cm each color cycle, appear in only three months of temporal gap. This demonstrates the strong subsidence caused by this kind of exploitations. Figure 5. Deformation velocity estimated using DISICC software (Advanced Differential Interferometry) in Sallent. Green points are stable and brown ones have maximum displacement. Finally, Figure 6 presents a comparison between levelling measurements and DISICC results of the temporal behaviour of deformation in the area of maximum velocity. This result shows the extraordinary fitting of absolute deformation measurements using these two different techniques. The advantage of advanced DInSAR relies on the capability of monitoring large areas with reduced costs compared with expensive field campaigns. Figure 4. Interferometric phase pattern of three deformation areas located in Catalonia due to mining activities. 0 1992 -2 1994 1996 1998 2000 2002 2004 • Manage great volume of data from diverse sources. • Develop and incorporate tools for spatial analysis. 2006 -4 -6 -8 Leveling -10 DInSA R Taking into account the exposed goals, the system architecture has been defined considering the requirements related with data storage and analysis tools: -12 -14 -16 -18 -20 Ye a r Figure 6. Combination of advanced DInSAR and leveling measurements for one point in the maximum deformation area of Sallent. • It allows storage and consulting of information with spatial components and great complexity. • The information has to be introduced and retrieved in standard formats or well documented ASCII files. • The data model allows SQL queries (including spatial ones). • The information storage has to fulfill OGC standards, so that can be accessed from multiple interfaces. On the other hand, data analysis of terrain deformation has to allow the access to different functionalities: 4. THE ARCGIS INTEGRATION The main goal of the whole DInSAR+ArcGIS project is the determination of hazard terrain subsidences and the development of risk management methodologies to support insurance policies. Obviously, these objectives need the implementation of an IT system using a Geographic Information System based on measurements from DInSAR techniques, geologic and geophysical surveying, and high topographic leveling (Marturià, 2006). The system has to be able to: • • • • • Interpolation. Longitudinal profiling. Graphic generation. Measure selection. Spatial and temporal data exportation. Moreover, the system permits locating and downloading geophysical data and access to ICC corporative data. Figure 7 shows the final GIS scheme. DATABASE DATA ACCES LIBRARY ARCSDE DATA LOAD/MANAGEMENT INTEFACE ANALYSIS TOOLS ICC CORPORATIVE DATA ACCESS Figure 7. GIS scheme. The database has an architecture based on the Oracle management system providing a spatial data storage format that can be read and edited by ArcGIS and it is independent from the GIS graphic interface. The data loading interface feeds the database entering the data access libraries in their loading options. This interface is independent from the GIS software and does not incorporate any kind of graphic interface. One objective of the data loading interface is to manage relations between different objects of the data model. Figure 8 shows an example of the presented interface. 5. CONCLUSIONS A new advanced DInSAR software developed by ICC has been presented. This software allows obtaining precise measurements of terrain deformations by means of SAR satellite data, taking advantage of stack image processing to minimize decorrelation factors. Several results are presented demonstrating the capabilities of this technique and its future use on risk management. The final implemented system allows the usage of different data sources with spatial and temporal components in the risk analysis. Apart form the data analysis regarding the subsidence hazard, coming fundamentally from DInSAR, precision topography and deformation measurements on boreholes (extensometry), the implemented system allows the user the consultation of geophysical data as well as the whole corporative data: geology, geotechnics, cadastre, etc. managed by ICC. The storage and access of the obtained spatial data fulfils the OGC standards. The access to this information is consequently independent from the GIS platform used and it could even be accessed from other environments. The data storage in a Relational Database Management System allows a corporative access, without the need to generate and keep data copies, safeguarding the data integrity. Finally, a set of GIS tools has been developed which will allow an easy data access and analysis. 6. ACKNOWLEDGMENTS This work has been partially financed by the INTERREG III B program (FEDER funds), Project RISCMASS, ref. 2003-034.3-I-014. “Méthodologies pour la gestion des Risques d’Éboulement et des Mouvements du sol avec Scénarios de Politique d’Assurance“ Figure 8. Data loading interface for DInSAR data. The data access libraries load and export the different elements of the database, such as DInSAR, geophysics or leveling network. Note that each one of the methods has been codified in an independent library. This separation results in their easy incorporation in other environments (GIS or Web). Finally, an analysis subsystem has been developed as a personalized toolbar in the ArcGIS environment. The available tools are the following: • • • • • Raster layering contouring. Profile generation. Temporal data selection. Excel format data exportation. Exportation Assistance for geophysical data. Regarding DInSAR data, the system is able to manage classical DInSAR products, such as the ones presented in Figures 3 and 4, as raster images. On the other hand, advanced DInSAR results, see Figures 5 and 6, are introduced as vector/point files, and temporal descriptions of the movement for each point can be retrieved (see Fig. 6). 7. REFERENCES Marturià, J., Martinez, P., Roca, A., 2006. Implementation of a Subsidence Risk Management System. European Congress on Regional Geoscientific Cartography and Information Systems, Barcelona, Spain, Vol. I, pp. 394-396. Massonet, D., 1993. The displacement field of the Landers earthquake mapped by radar interferometry. Nature, Vol. 364, pp. 138-142. Mora, O., Mallorquí, J., Broquetas, A, 2003. Linear and Nonlinear Terrain Deformation Maps From a Reduced Set of Interferometric SAR Images. IEEE Transactions on Geoscience and Remote Sensing, Vol. 41, No. 10. Mora, O., Arbiol, R., Palà, V., 2006a. Advanced DInSAR techniques for monitoring terrain displacements. European Congress on Regional Geoscientific Cartography and Information Systems, Barcelona, Spain, Vol. II, pp. 324-326. Mora, O., Arbiol, R., Palà, V., Adell, A., Torre, M., 2006b. Generation of accurate DEMs using DInSAR methodology (TopoDInSAR). IEEE Letters on Geoscience and Remote Sensing, accepted for publication.
![[PS3-B.92] Deriving glacier flow of Comfortlessbreen, Svalbard, with 2-pass differential SAR interferometry](http://s2.studylib.net/store/data/011437273_1-88e0d14685f316dfdf96d3e475d13e45-300x300.png)
