Comparison of Broadband and Hyperspectral Sensors for Lantana Mapping. S. Taylor
advertisement
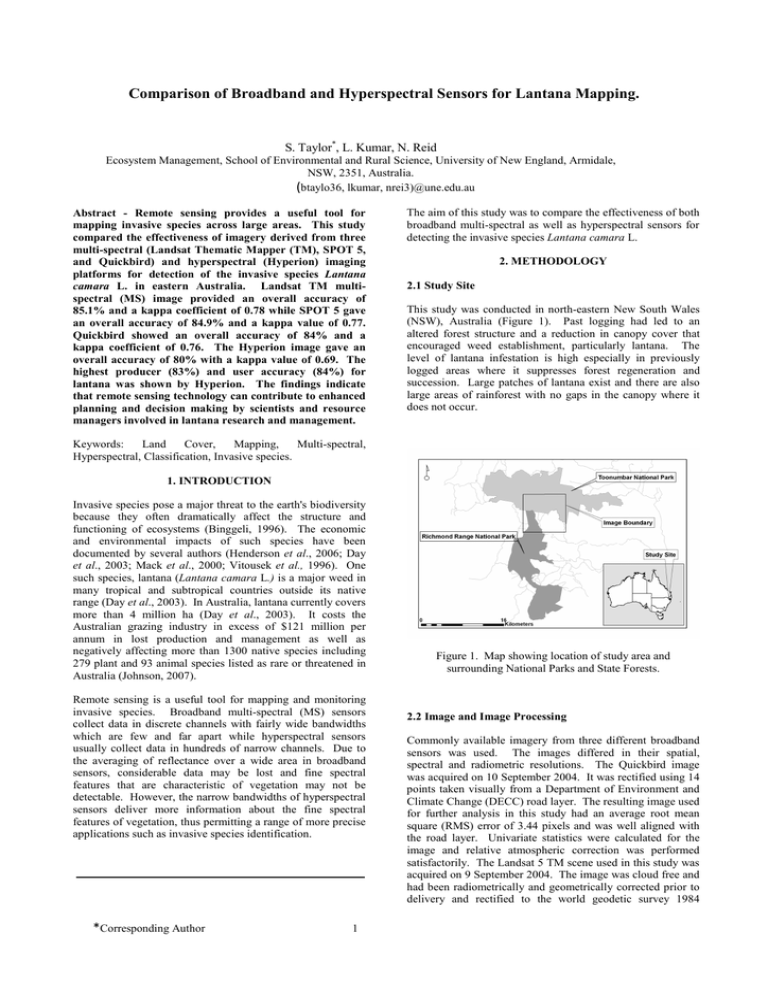
Comparison of Broadband and Hyperspectral Sensors for Lantana Mapping. S. Taylor*, L. Kumar, N. Reid Ecosystem Management, School of Environmental and Rural Science, University of New England, Armidale, NSW, 2351, Australia. (btaylo36, lkumar, nrei3)@une.edu.au Abstract - Remote sensing provides a useful tool for mapping invasive species across large areas. This study compared the effectiveness of imagery derived from three multi-spectral (Landsat Thematic Mapper (TM), SPOT 5, and Quickbird) and hyperspectral (Hyperion) imaging platforms for detection of the invasive species Lantana camara L. in eastern Australia. Landsat TM multispectral (MS) image provided an overall accuracy of 85.1% and a kappa coefficient of 0.78 while SPOT 5 gave an overall accuracy of 84.9% and a kappa value of 0.77. Quickbird showed an overall accuracy of 84% and a kappa coefficient of 0.76. The Hyperion image gave an overall accuracy of 80% with a kappa value of 0.69. The highest producer (83%) and user accuracy (84%) for lantana was shown by Hyperion. The findings indicate that remote sensing technology can contribute to enhanced planning and decision making by scientists and resource managers involved in lantana research and management. The aim of this study was to compare the effectiveness of both broadband multi-spectral as well as hyperspectral sensors for detecting the invasive species Lantana camara L. 2. METHODOLOGY 2.1 Study Site This study was conducted in north-eastern New South Wales (NSW), Australia (Figure 1). Past logging had led to an altered forest structure and a reduction in canopy cover that encouraged weed establishment, particularly lantana. The level of lantana infestation is high especially in previously logged areas where it suppresses forest regeneration and succession. Large patches of lantana exist and there are also large areas of rainforest with no gaps in the canopy where it does not occur. Keywords: Land Cover, Mapping, Multi-spectral, Hyperspectral, Classification, Invasive species. 1. INTRODUCTION Invasive species pose a major threat to the earth's biodiversity because they often dramatically affect the structure and functioning of ecosystems (Binggeli, 1996). The economic and environmental impacts of such species have been documented by several authors (Henderson et al., 2006; Day et al., 2003; Mack et al., 2000; Vitousek et al., 1996). One such species, lantana (Lantana camara L.) is a major weed in many tropical and subtropical countries outside its native range (Day et al., 2003). In Australia, lantana currently covers more than 4 million ha (Day et al., 2003). It costs the Australian grazing industry in excess of $121 million per annum in lost production and management as well as negatively affecting more than 1300 native species including 279 plant and 93 animal species listed as rare or threatened in Australia (Johnson, 2007). Remote sensing is a useful tool for mapping and monitoring invasive species. Broadband multi-spectral (MS) sensors collect data in discrete channels with fairly wide bandwidths which are few and far apart while hyperspectral sensors usually collect data in hundreds of narrow channels. Due to the averaging of reflectance over a wide area in broadband sensors, considerable data may be lost and fine spectral features that are characteristic of vegetation may not be detectable. However, the narrow bandwidths of hyperspectral sensors deliver more information about the fine spectral features of vegetation, thus permitting a range of more precise applications such as invasive species identification. *Corresponding Author 1 Figure 1. Map showing location of study area and surrounding National Parks and State Forests. 2.2 Image and Image Processing Commonly available imagery from three different broadband sensors was used. The images differed in their spatial, spectral and radiometric resolutions. The Quickbird image was acquired on 10 September 2004. It was rectified using 14 points taken visually from a Department of Environment and Climate Change (DECC) road layer. The resulting image used for further analysis in this study had an average root mean square (RMS) error of 3.44 pixels and was well aligned with the road layer. Univariate statistics were calculated for the image and relative atmospheric correction was performed satisfactorily. The Landsat 5 TM scene used in this study was acquired on 9 September 2004. The image was cloud free and had been radiometrically and geometrically corrected prior to delivery and rectified to the world geodetic survey 1984 (WGS 84) datum and the Universal Transverse Mercator (UTM) zone 56 coordinate system. The SPOT 5 image was acquired on 4 March 2005. The scene was cloud free and had been orthorectified prior to delivery to the Geocentric Datum of Australia 1994 (GDA94) datum and the Map Grid of Australia (MGA) zone 56 coordinate system. The image had an RMS error of 0.16 pixels. The Ortho and Geocoding Wizard in ERMapper was used to transform this map projection to the WGS84 datum and the UTM zone 56 coordinate system. This was done to ensure that all images were in the same map projections. observed 8 months later in May. The area had also remained stable as it is a protected area of national park. Therefore, even though the SPOT 5 image was captured approximately six months and the Hyperion image was captured 8 months after the Quickbird and Landsat TM images, the delay would not exert any tangible impact on the mapping accuracy as there had been virtually no change in the distribution and density of lantana. Data for training sites and accuracy analysis was also collected from areas which were mature and undisturbed and this was also verified through the forest rangers who worked in the area. This was done to account for the gap between the image acquisition times. The Hyperion image was acquired on 24 May 2005. Although the level 1 radiometric (1R) product has a total of 242 bands, only 198 bands are calibrated. Several of the Hyperion sensor's bands are unusable, particularly those at wavelengths most prone to atmospheric scattering, so that United States Geological Survey (USGS) delivers level 1R Hyperion data with 44 bands set to 0 values (USGS, 2003). Among the 198 bands, there are four remaining bands in the overlap between the two spectrometers. These are the visible and near-infrared (VNIR) bands 56 and 57 and shortwave infrared (SWIR) bands 77 and 78. It is usual to eliminate two of these to obtain 196 unique bands. In this study, bands 8 to 57 and 79 to 224 were selected as 196 unique bands since the SWIR band 78 had the higher level of base noise after de-striping (Datt et al., 2003). Hyperion bands are also affected by the three major water vapour absorption areas as well as features due to O2 and CO2 where very little signal from the ground surface is recorded by the sensor. Datt et al. (2003) suggested that these bands, which are most likely to contain unstable atmospheric artefacts, can also be eliminated. Based on this, a subset of 155 ‘stable’ bands was selected for further analysis. Atmospheric correction of the Hyperion scene was performed with ENVI‘s Fast Line-of-sight Atmospheric Analysis of Spectral Hypercubes (FLAASH). This procedure converts the data from radiance to apparent surface reflectance and is an important procedure for spectral analysis based mapping methods. The image was pre-processed prior to conversion using the following steps: repair of ‘bad’ pixel values, fixing of out-of-range data, fixing of outliers, de-smiling and destriping (Datt et al., 2003). These researchers found that the pre-processing steps were the best noise management strategy and selection of 155 stable bands provided a simple but effective way of avoiding any residual noise that may remain after the processing. A Landsat Thematic Mapper (TM) rectified image was used as a base map for georectification. The Landsat image had been terrain corrected prior to delivery and provided systematic radiometric and geometric accuracy by incorporating ground control points while employing a Digital Elevation Model (DEM) for topographic accuracy (USGS, 2010). The 30m pixel size provided adequate spatial resolution and rectification insured that geographic fidelity was consistent throughout the image. Ten ground control points (GCP) were selected with good dispersion throughout the image. A first order polynomial transformation with nearest neighbour resampling was used to retain as much spectral fidelity as possible. The resulting image had an estimated total root mean square (RMS) error of 0.0795 pixels or about 2.4 m. A sub-scene covering the areal extent of the Quickbird image was extracted from the Landsat TM, SPOT 5 and Hyperion images using the ENVI image processing software package (ENVI 2003). These sub-scenes were used in subsequent classifications. 2.3 Multi-spectral Image Classification Ground Control Points (GCPs) and data for training classes were collected between the 3rd and 4th of September 2004. The extent of lantana and the coordinates of each site were recorded. An estimated scale of low to high density was assigned to the level of lantana; low density reflected no lantana or the presence of odd, small individual plants, medium density was an intermediate level of lantana where healthy growth was visible but it was still low and had not grown upon itself, high density represented extreme infestations of lantana, often over 2 meters in height, and using trees for climbing. For supervised classification, 50 training areas were derived by field work and visual image inspection. These training areas were merged into three specific land-cover classes for the classification, namely pasture, forest and lantana. Training classes such as pasture were determined visually from the image and field knowledge. Each classification was performed and assessed with identical training and accuracy assessment samples to ensure comparable results for the three multispectral images of varying spatial and spectral resolutions. Instead of using a single pixel at each of the 50 training sites, a cluster of pixels was taken around the point. The 50 points were exported to ArcGIS (ESRI 2008) and a buffer covering an area of 90 m x 90 m on the ground was generated around each point. This polygon layer was then used as training areas for each image. For the SPOT 5 and Quickbird images, these buffers captured approximately a 9x9 and 37x37 window respectively around each sampling point. A Maximum Likelihood classification was performed using ENVI software. A second visit to the field was undertaken to verify the accuracy of the classification and determine how well the classified pixels matched with the ground data. Coordinates for 95 sites had been randomly selected within the study area. Thirty five of these had been identified as pasture, twenty five as forest and thirty five as lantana in the classified image. The data sheet for the accuracy field visit noted the coordinates of the sampling location but did not include the vegetation class as to eliminate bias from the accuracy check. The accuracy assessment samples were taken to be the same size (90 m x 90 m) and were generated in a similar way to the training samples. Each cluster of pixels was treated as one sampling unit and during the field visit vegetation was noted within this area. These data were used to derive an error matrix and the kappa (K) value was calculated. 2.4 Hyperspectral Image Classification A visual assessment showed that there was no visible change between the lantana as observed in September and the lantana 2 Field data were collected at various sample locations in the same study site and typical vegetation categories were identified and noted. After careful evaluation of the vegetation data from these sample sites, 72 sites were chosen based on vegetation structure. Of these 72 sites, some consisted of large pure stands of lantana and some were free of lantana infestation. The area selected for each site was homogeneous within a 60 m x 60 m square, the equivalent of four Hyperion pixels. The data collected for each square included the GPS coordinates, main vegetation species, percent canopy cover and ground cover. These data were used for training and validation of the classifier. The categories were generalized into two classes, lantana and non-lantana. One additional class labelled pasture was created and regions of interest were defined by visual means from the imagery as it was a spectrally distinct class. Table 1. Overall accuracy, Kappa coefficient and lantana producer and user accuracies of the three classifications. Sensor Overall Accuracy (%) Kappa Landsat TM SPOT 5 Quickbird Hyperion 85.1 84.9 84.0 80.1 0.78 Lantana Producer Accuracy (%) 77.0 Lantana User Accuracy (%) 81.5 0.77 0.76 0.69 81.5 77.4 83.3 78.8 78.7 84.4 Landsat TM performed marginally better than the other two broadband sensors with an overall accuracy that was 0.2% and 1.1% higher than SPOT 5 and Quickbird respectively. Landsat TM also yielded user accuracy for lantana category that was 2.7% and 2.8% higher than SPOT 5 and Quickbird respectively. Hyperion yielded a lower overall accuracy of 80.1% compared to the three broadband sensors. However, it gave the best lantana producer and user accuracies of all four sensors. For the classification, three specific land-cover classes, pasture, lantana and non-lantana, were identified based on field knowledge. Pasture was chosen because it was identifiable in the image and therefore its spectra could be easily extracted from the image for classification. Nonlantana was created because we were only interested in lantana as a target species. Therefore all other vegetation types were put into a single class labelled non-lantana. Twenty-nine sites that were identified from field knowledge as pure lantana and non-lantana (this last category consisted of a mixture of different species but no lantana) were selected for training the classifier. An additional 14 training sites were chosen for the spectrally distinct pasture class from the imagery. Spectral reflectance was extracted for these classes from the image by creating regions of interest (ROIs) based on visual inspection of the Hyperion image and field data. Mean spectra were then extracted for each ROI from the reflectance data to act as endmembers for each class. These were then used as reference spectra in the Spectral Angle Mapper (SAM) classifier. SAM compares the angle between the reference spectrum vector and each pixel vector in n-dimensional space. Smaller angles represent closer matches to the reference spectrum. Pixels further away than the specified maximum angle threshold in radians are not classified. In this study, the spectral angle threshold was set to 0.3 radians. The accuracy assessment data consisted of 57 verification sites for the three land-cover classes. These data were used to derive an error matrix and the kappa (K) value was calculated. Lantana biology lends itself to remote sensing mapping due to its preference to grow in monoculture environments in open or disturbed areas readily seen by satellite sensors (Stewart et al. 2008). It forms dense thickets while crowding out more desirable species in such areas. This was observed in the study site where lantana infestation was quite extensive in disturbed areas but non-existent in rainforest areas with a closed canopy. Lantana patches were large enough to be discernible in the 30 m TM imagery and therefore improvement in spatial resolution from 30 to 10 m (SPOT 5) and 2.4 m (Quickbird) did not improve the interpretability of lantana. However, Quickbird and SPOT 5 may be more suited for the detection of patchy and fragmented infestations. The focus of this study was large, mature and homogeneous stands of lantana which lends itself to the large 30 m Landsat TM pixels. Hyperion, on the other hand, provided the lowest overall accuracy and kappa value of the four images. It did not perform as well as Landsat TM despite having a similar spatial resolution. The differences in training site selection and accuracy assessment for the hyperspectral image could have played a part in the lower overall accuracy. Also the selection of the classification method may have had an impact as well. Yang and Everitt (2010) compared five different classification methods with hyperspectral and multi-spectral data and found that maximum likelihood was superior to other algorithms such as SAM. However, the enhanced spectral resolution of the Hyperion image appeared to play a role in the superior lantana producer and user accuracies shown by this sensor. The narrow bandwidths of the hyperspectral dataset were useful in avoiding spectral confusion between lantana and its co-occurring species. This would be difficult to achieve with the wide bandwidths and band placements of the broadband sensors. While overall accuracy, producer accuracy and user accuracy are each important to understand how well a classification performed (Congalton 1991), user accuracy is a good measure of the classification’s reliability and subsequent success with a land manager. This study demonstrated that Hyperion produced the highest user accuracy for the lantana category. 3. RESULTS AND DISCUSSION The resulting accuracies of the four images presented in this study were compared using overall accuracy, kappa value and lantana producer and user accuracies (Table 1). Different classification techniques were used in order to optimize the information contained in each image to yield the best results and also to take advantage of the techniques specifically designed for the imagery. The multi-spectral and hyperspectral images could have been classified using one standard classification algorithm such as Maximum Likelihood. However, this was not considered optimal in this case. According to Lumme (2004), traditional algorithms like Maximum Likelihood tend not to work properly with hyperspectral data as it consists of hundreds of channels and requires more computation time. Furthermore, a large number of training samples are required for this classifier to work effectively with hyperspectral data and this may not be practically feasible. 3 P. Binggeli, “A taxonomic, biogeographical and ecological overview of invasive woody plants,” J. Veg. Sci., vol 7, p.p. 121-124, 1996. P.M. Vitousek, C.M. D’Antonio, L.L. Loope, and R. Westbrooks, “Biological invasions as global environmental change,” Am. Sci., vol. 84, p.p. 218–228, 1996. R.G. Congalton, “A review of assessing the accuracy of classifications of remotely sensed data,” Rem. Sens. Env., vol. 37, p.p. 35-46, 1991. R. Mack, D. Simberloff, M. Lonsdale, H. Evans, M. Clout, and F. Bazzaz, “Biotic invasions: cause, epidemiology, global consequences, control,” Ecol. Appl., vol. 10, p.p. 689–710, 2000. R.L. Lawrence, S.H. Wood, and R.L. Sheley, “Mapping invasive plants using hyperspectral imagery and Breiman Cutler classifications (RandomForest),” Rem. Sens. Env., vol. 100, p.p. 356–362, 2006. S. Henderson, T.P. Dawson, and R.J. Whittaker, “Progress in invasive plants research,” Prog. Phys. Geog., vol. 30, p.p. 2546, 2006. USGS, “EO-1 User‘s Guide,” URL: http://eo1.usgs.gov, 4. CONCLUSIONS This study has demonstrated the utility of multi and hyperspectral remote sensing imagery for mapping the invasive species lantana. Many researchers have evaluated various types of imagery to map invasive weeds in different parts of the world (Everitt et al., 2008; Lawrence et al., 2006; McGowen et al., 2007). However, there is no single technique that is guaranteed to be successful in every situation. Many factors influence the distribution of invasive species. Among these are the size of the area to be mapped, the computational requirements, the cost of imagery as well as the complexity of the associated plant communities. Furthermore, choosing between multi-spectral and hyperspectral imagery depends on factors such as the complexity and similarity of the invasive species and its co-occurring species as well as data processing capability. Although multi-spectral imagery generally tends to be cheaper and easier to process, hyperspectral imagery provides richer spectral information and therefore offers the potential for more accurate classification results. Each study site is different in its composition of plant species as well as the environmental conditions that are present for growth. Therefore it is important to evaluate various types of imagery as well as classification algorithms to identify the best ones for each particular site. 2003. USGS, “Thematic Mapper (TM) Product Description,” URL:http://eros.usgs.gov/#/Find_Data/Products_and_Data_A vailable/TM, 2010. ACKNOWLEDGMENT The authors are grateful to Steven King from the Department of Environment, Climate Change and Water (DECCW) for providing access to the study site and support in field work. We would also like to thank DECCW for providing the SPOT 5 image. REFERENCES B. Datt, T.R. McVicar, T.G. Van Niel, D.L.B. Jupp and J.S. Pearlman, “Pre-processing EO-1 Hyperion hyperspectral data to support the application of agricultural indexes,” IEEE Trans. Geosci. and Rem. Sens., vol. 41, p.p. 1246–1259, 2003. C. Yang, and J.H. Everitt, “Mapping three invasive weeds using airborne hyperspectral imagery,” Ecol. Info., vol. 5, p.p. 429–439, 2010. ENVI, “ENVI Software, Version 4.5, Research Systems Inc,” 2008. ESRI, “ArcGIS Software, Version 9.3, Environment Systems Research Institute,”2008. I. McGowen, P. Frazier, and P. Orchard, “Remote Sensing for broad scale weed mapping - is it possible?” Sydney: New South Wales Agriculture, 2001. J.H. Lumme, “Classification of vegetation and soil using imaging spectrometer data,” Proceedings of the ISPRS Congress, Commission VII, 12–23 July, 2004, Istanbul, Turkey, unpaginated CD-ROM. J.H. Everitt, R.S. Fletcher, H.S. Elder, and C, Yang, “Mapping giant salvinia with satellite imagery and image analysis,” Environ. Monit. Assess., vol. 139, p.p. 35–40, 2008. K. Johnson, “Review of progress towards the Lantana camara strategic plan,” Brisbane: Queensland Department of Primary Industries and Fisheries, 2007. M.D. Day, C.J. Wiley, J. Playford, and M.P. Zalucki, “Lantana: Current management status and future prospects,” ACIAR Monograph. Canberra: Australian Centre for International Agricultural Research, 2003. 4
