ASSESSMENT OF DEM MOSAIC ACCURACY
advertisement

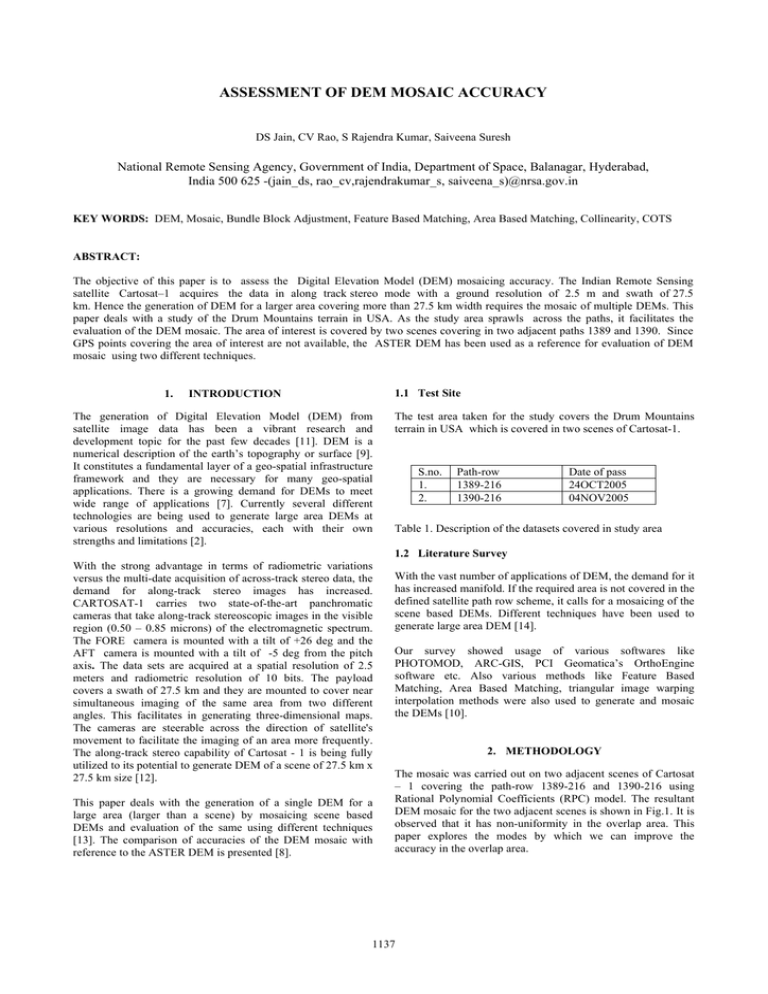
ASSESSMENT OF DEM MOSAIC ACCURACY DS Jain, CV Rao, S Rajendra Kumar, Saiveena Suresh National Remote Sensing Agency, Government of India, Department of Space, Balanagar, Hyderabad, India 500 625 -(jain_ds, rao_cv,rajendrakumar_s, saiveena_s)@nrsa.gov.in KEY WORDS: DEM, Mosaic, Bundle Block Adjustment, Feature Based Matching, Area Based Matching, Collinearity, COTS ABSTRACT: The objective of this paper is to assess the Digital Elevation Model (DEM) mosaicing accuracy. The Indian Remote Sensing satellite Cartosat–1 acquires the data in along track stereo mode with a ground resolution of 2.5 m and swath of 27.5 km. Hence the generation of DEM for a larger area covering more than 27.5 km width requires the mosaic of multiple DEMs. This paper deals with a study of the Drum Mountains terrain in USA. As the study area sprawls across the paths, it facilitates the evaluation of the DEM mosaic. The area of interest is covered by two scenes covering in two adjacent paths 1389 and 1390. Since GPS points covering the area of interest are not available, the ASTER DEM has been used as a reference for evaluation of DEM mosaic using two different techniques. 1. 1.1 Test Site INTRODUCTION The generation of Digital Elevation Model (DEM) from satellite image data has been a vibrant research and development topic for the past few decades [11]. DEM is a numerical description of the earth’s topography or surface [9]. It constitutes a fundamental layer of a geo-spatial infrastructure framework and they are necessary for many geo-spatial applications. There is a growing demand for DEMs to meet wide range of applications [7]. Currently several different technologies are being used to generate large area DEMs at various resolutions and accuracies, each with their own strengths and limitations [2]. The test area taken for the study covers the Drum Mountains terrain in USA which is covered in two scenes of Cartosat-1. S.no. 1. 2. Path-row 1389-216 1390-216 Date of pass 24OCT2005 04NOV2005 Table 1. Description of the datasets covered in study area 1.2 Literature Survey With the strong advantage in terms of radiometric variations versus the multi-date acquisition of across-track stereo data, the demand for along-track stereo images has increased. CARTOSAT-1 carries two state-of-the-art panchromatic cameras that take along-track stereoscopic images in the visible region (0.50 – 0.85 microns) of the electromagnetic spectrum. The FORE camera is mounted with a tilt of +26 deg and the AFT camera is mounted with a tilt of -5 deg from the pitch axis. The data sets are acquired at a spatial resolution of 2.5 meters and radiometric resolution of 10 bits. The payload covers a swath of 27.5 km and they are mounted to cover near simultaneous imaging of the same area from two different angles. This facilitates in generating three-dimensional maps. The cameras are steerable across the direction of satellite's movement to facilitate the imaging of an area more frequently. The along-track stereo capability of Cartosat - 1 is being fully utilized to its potential to generate DEM of a scene of 27.5 km x 27.5 km size [12]. This paper deals with the generation of a single DEM for a large area (larger than a scene) by mosaicing scene based DEMs and evaluation of the same using different techniques [13]. The comparison of accuracies of the DEM mosaic with reference to the ASTER DEM is presented [8]. With the vast number of applications of DEM, the demand for it has increased manifold. If the required area is not covered in the defined satellite path row scheme, it calls for a mosaicing of the scene based DEMs. Different techniques have been used to generate large area DEM [14]. Our survey showed usage of various softwares like PHOTOMOD, ARC-GIS, PCI Geomatica’s OrthoEngine software etc. Also various methods like Feature Based Matching, Area Based Matching, triangular image warping interpolation methods were also used to generate and mosaic the DEMs [10]. 2. METHODOLOGY The mosaic was carried out on two adjacent scenes of Cartosat – 1 covering the path-row 1389-216 and 1390-216 using Rational Polynomial Coefficients (RPC) model. The resultant DEM mosaic for the two adjacent scenes is shown in Fig.1. It is observed that it has non-uniformity in the overlap area. This paper explores the modes by which we can improve the accuracy in the overlap area. 1137 The International Archives of the Photogrammetry, Remote Sensing and Spatial Information Sciences. Vol. XXXVII. Part B8. Beijing 2008 defined by a datum. The angular or rotational elements of exterior orientation describe the relationship between the ground space coordinate system (X, Y and Z) and the image space coordinate system (x, y and z). Three rotation angles are commonly used to define angular orientation. They are omega (ω), phi (ψ) and kappa (κ). Fig.2 illustrates the elements of exterior orientation. Fig.1 DEM mosaic of two adjacent scenes 1389-216 and 1390216 of Cartosat – 1 The reference used in our study is the ASTER DEM [15]. The Advanced Spaceborne Thermal Emission and Reflection Radiometer (ASTER), on-board the NASA’s TERRA satellite, provides along-track near-IR stereoscopic images at 15m resolution. The Algorithm Theoretical Basis Document, ATBD, for ASTER Digital Elevation Models [3] suggests that the RMSE for Z values in ASTER DEM should be in the order of 10 to 50 m, but this is a too wide range to define the accuracy of a product [16]. The Cartosat- 1 DEM has Planimetry accuracy of 15m (CE 90) and an elevation accuracy of 4m to 8m (LE 90) provided proper ground control points are available [17]. As no other reference is available, control points are taken from this DEM and comparative studies are done. 3. STUDIES WITH DIFFERENT MODES Studies were carried out firstly by using only RPC file and generating tie points. The DEM was improved by refining the tie points. The second method explored was by taking control points from the ASTER DEM. 3.1 Bundle block adjustment Technique: The LPS module of the Commercial-Off-The-Shelf (COTS) software was used to generate DEM using the stereo pairs obtained from Cartosat-1. Individual DEMs of each stereo pair were found to be good. DEM mosaic was generated using the RPC model and auto tie-points generation mode. The output DEM had non-uniformity in the features as well as radiometry in the overlap area. Interior orientation was performed and the image pixel coordinate system was transformed to the image coordinate system. Next the images were processed for exterior orientation, which defines the position and angular orientation associated with the image. The elements of exterior orientation (the variables defining the position and orientation) define the characteristics associated with an image at the time of exposure or capture. The positional elements of exterior orientation include Xo, Yo and Zo, which define the position of the perspective center (O) with respect to the ground space coordinate system (X, Y and Z). Zo is commonly referred to as the height of the camera above sea level, which is commonly Fig.2 Picture depicting the exterior orientation A bundle block adjustment is best defined by examining the individual words in the term. A bundled solution is computed including the exterior orientation parameters of each image in a block and the X, Y and Z coordinates of tie points and adjusted GCPs. A block is a single set of images which is simultaneously processed for one solution. A statistical technique known as least squares adjustment is used to estimate the bundled solution for the entire block while also minimizing and distributing error. Block triangulation is the process of defining the mathematical relationship between the images contained within a block, the sensor model and the ground. Once the relationship has been defined, an accurate imagery and information concerning the Earth’s surface can be created. There are several models for block triangulation. The common models used in photogrammetry are block triangulation with the strip method, the independent model method, and the bundle method. Among them, the bundle block adjustment is the most rigorous of the above methods considering the minimization and distribution of errors. Bundle block adjustment uses the collinearity condition as the basis for formulating the relationship between image space and ground space [5]. The least squares approach requires iterative processing until a solution is attained. A solution is obtained when the residuals associated with the input data are minimized. The least squares approach involves determining the corrections to the unknown parameters based on the criteria of minimizing input measurement residuals. The residuals are derived from the difference between the measured and computed value for any particular measurement in a project. In the block triangulation process, a functional model can be formed based upon the collinearity equations. The functional model refers to the specification of an equation that can be used to relate measurements to parameters. In the context of photogrammetry, measurements include the image locations of GCPs and GCP coordinates, while the exterior orientations of all the images are 1138 The International Archives of the Photogrammetry, Remote Sensing and Spatial Information Sciences. Vol. XXXVII. Part B8. Beijing 2008 important parameters estimated by the block triangulation process. Nonuniformity seen in the overlap area The stereo pairs were processed through the block triangulation procedure. The tie points were extracted using feature point extraction algorithms. Feature points appearing on multiple images were automatically matched and identified. Erroneous points were visually identified and removed from the solution. Hence the final number of tie points defined were manually selected as the final number of tie points [6]. The image matching strategies for automatic tie point collection include the coarse-to-fine matching, feature-based matching with geometrical and topological constraints [4], which is simplified from the structural matching algorithm and the least square matching for the high accuracy of tie points. Through the auto-tie process additional tie points were identified and through bundle adjustment triangulation was done. To refine further, control points were added from the ASTER DEM. It is to be noted that ASTER DEM has its own inaccuracies, but this was the only reference available for the study. The individual DEMs are as shown in the figure 3 and 4. Fig.5 DEM mosaic using Bundling generated with only RPC file Contours were generated for the above DEM with an interval of 75m as shown in Fig.6. As is seen from the figure, the contours are not continuous smooth lines in the overlap area but it is observed that there are islands in the overlap area. Fig.6 Contours showing the non-uniformity in overlap area Fig.3 DEM of Path-row 1389-216 with RPCs and tie-points To improve the mosaiced DEM accuracy, more GCPs were identified in the overlap area using the ASTER DEM. These GCPs were taken as control points and some more tie-points generated through the auto-tie point generation. Considerable improvement was observed in the overlap area. The mosaiced DEM is shown in Fig.7. Uniformity in overlap area of the DEM Fig. 4 DEM of Path-row 1390-216 with RPCs and tie-points The DEM mosaic was done through bundling technique by adding both the images in the project file. The RPC file of each image pair was used and tie-points generated by the auto-tie process. The resultant mosaiced DEM was found to have nonuniformity in the overlap area. The resultant DEM mosaic is shown in Fig.5 Fig.7 DEM mosaic generated using Bundling technique by improving the tie points The corresponding contours are shown in Fig. 8. As is observed from the figure, the contour lines are observed to be smooth and continuous in the overlap area. 1139 The International Archives of the Photogrammetry, Remote Sensing and Spatial Information Sciences. Vol. XXXVII. Part B8. Beijing 2008 generated with ASTER DEM as reference is found to be around 17m whereas for the DEM generated through the RPC file is found to be 42m. 2500 2000 15 0 0 AST ER RPC+CT L PT S 10 0 0 500 Fig.8 Contours of DEM mosaic generated by taking control points from ASTER DEM 0 1 The only reference from which control points could be taken was the ASTER DEM. The control points were limited to natural river junctions for which the accuracy might not have been good. But these were the best possible control points which we could take from the reference DEM. The DEM generated with these control points and tie-points was found to be more accurate when compared with the DEM generated only through RPCs and tie points. 2 3 4 5 6 7 8 9 10 (a) 2500 2000 15 0 0 AST ER RPC 4. RESULTS 10 0 0 The results obtained are given in Table 1. 500 SNO ASTER RPC+CTL PTS RPC B-C B-D 1 2150.4 2140.9 2121.3 9.5 29.1 2 1973.3 1908.9 1898.7 64.4 74.6 3 1720.7 1722.6 1716.2 -1.9 4.5 4 1709.1 1683.7 1667.2 25.4 41.9 5 1873.7 1867 1830.3 6.7 43.4 6 1671.3 1671.38 1613.9 -0.08 57.4 7 1785.4 1770.12 1761.2 15.28 24.2 8 1869.9 1851.1 1806.3 18.8 63.6 0 1 2 3 4 5 6 7 8 9 10 (b) Fig.9 Comparative graphs between ASTER DEM and DEMs generated by (a) taking control points from ASTER DEM and (b) only RPC file Figure 9(a) shows the graph between ASTER DEM and DEM generated by taking control points from the ASTER DEM and RPC file. Figure 9(b) shows the graph between the ASTER DEM and DEM generated only with RPCs. As seen from the figures, the DEM generated by taking control points from the ASTER DEM has an accuracy almost close to the reference. 17.2625 42.3375 Table 1. Comparative table showing the differences between ASTER DEM and DEMs generated by using control points from reference and only RPC file. Since the area covered is in Drum Mountains, USA, the other references like topo maps, GPS points etc. were not available for the study. As seen from Table 1, the ASTER DEM is taken as reference and it is compared with the DEMs generated from the RPC file and one generated with control points taken from the ASTER DEM [1]. In our studies we had taken check points which were more prominent and easily identifiable to maintain the accuracy of the study. This was the best possible option as no other control points were available. As seen from the table, it is observed that a maximum error of around 64m is observed in the DEM generated with control points taken from the ASTER DEM. As regards the DEM generated from the RPC file with further refinement of tie points, a maximum error of around 74m is observed. Overall the error noticed in the DEM 5. CONCLUSIONS The distribution of accurate control points in the overlap area results in a uniform DEM in the overlap area. Also by generating tie points with only the RPCs and without control points show that the accuracy can be further improved giving highly accurate points as control points. Other studies show that with precise control points taken from GPS / DGPS, the accuracies of the DEM varied from 4m to 10m [16]. In the study conducted an average error of around 17 m is observed wrt ASTER DEM which itself has inherent errors. If no reference is used for control points an average error of around 42m is observed. This study also shows the good accuracy of the RPCs in Cartosat-1 products which is improved with control points taken from the ASTER DEM. Thus the 1140 The International Archives of the Photogrammetry, Remote Sensing and Spatial Information Sciences. Vol. XXXVII. Part B8. Beijing 2008 accuracy of 4 to 10m can be easily achieved if control points are taken from precise GPS / DGPS points. Also there is a difference in the accuracies of the DEM generated by taking control points from the ASTER DEM when compared to the accuracies achieved when control points are taken from the precise sources like GPS / DGPS. This shows the role of the accuracy of the control points in the model for generation of DEMs. Here the accuracy of the control points taken from the ASTER DEM is subjected to various inherent errors like its own inaccuracies, human error in identifying the control points and availability of accurate points in the image. In our future studies, the usage of GPS points is being looked into. Since the accuracy of these GPS points is of the order of a few centimeters, it is expected to achieve considerable improvement in the accuracy of the DEM. REFERENCES 1. 2. MS Hashemian, A.Abootalebi and F.Kianifar “Accuracy evaluation of DEM generated from SPOT5 HRS imageries” VF Chekalin, MM Fomtchenko “Comparative characteristics of DEM obtained from satellite images SPOT-5 and TK-350” 3. Nektarios Chrysoulakis, Michael Abrahams, Haralambos Feidas and Dimitros Veliantitis: Analysis of ASTER multispectral stereo imagery to produce DEM and land cover databases for Greek islands : the REALDEMS project: EU-LAT Workshop on e-Environment. 4. Hans-Gerd Maas: Automatic DEM generation by multiimage feature based matching: 18th ISPRS Congress, Vienna, July 9-19, 1996 IAPRS Vol.31, Part B3, pp.484489 7. Kim, S., Kang, S., 2001. Automatic generation of a SPOT DEM: Towards coastal disaster monitoring. Korean Journal of remote Sensing, 17(2), pp.121-129. 8. Reinartz,P., Lehner, M., Muller, R., M., Schroeder, M., 2003. First results on Accuracy Analysis for DEM and Orthoimages derived from SPOT HRS Stereo Data over Bavari www.ipi.uni-hannover.de/ html/ publikationen/ 2003/ workshop/baudoin.pdf 9. Siva Subramanian, KS Singh, A., Sudhakar, M., 2003. Evaluation of Digital Elevation Models Created from different satellite Images. www.gisdevelopment.net/ technology/rs/mi03079.htm. 10. Toutin, T., 1995. Generating from stereo Images with a Photogrammetric Approach: Examples with VIR and SAR data, EarSeL Advances in Remote Sensing. 4(2), pp.110117. 11. Thiery Toutin - Map Updating using Medium and High Resolution remote Sensing and GIS: Canada Centre for Remote Sensing 12. Curt.H.Davis and Xiangyun Wang: High Resolution DEMs for Urban Applications from NAPP Photography 13. High Resolution DEMs and Ortho-Image Basemaps for local government Applications: ICREST 14. Thomas Kraub,Peter Reinartz, Manfred Lehner, Manfred Scroeder, Uwe Stilla: DEM generation from very high resolution stereo satellite data in urban areas using dynamic programming 15. A.Cuartero, AM Felicisimo, FJ Ariza : Accuracy of DEM generation from TERRA-ASTER Stereo data; Commission VI, WG VI/4 16. http://antrix.gov.in/irsp5.html 5. Ch. Briese, N.Pfeifer, P.Dorninger” Applications of the robust interpolation for DTM determination 17. Augmented Stereo Strip triangulation Software Analysis and Architecture Document, June 2006. 6. Fengliang Xu, Kaichang Di, Ron Li, Larry Matthies and Clark F. Olson: Automatic feature registration and DEM generation for Martian surface mapping: International Archives of Photogrammetry, remote Sensing and Spatial Information Sciences, Vol.34, Part 2, Commn. II, Xian, Aug.20-23, 2002, pp.549-554. ACKNOWLEDGEMENTS The authors are grateful to Dr.Radhakrishnan, Director, NRSA for his kind support and encouragement. 1141 The International Archives of the Photogrammetry, Remote Sensing and Spatial Information Sciences. Vol. XXXVII. Part B8. Beijing 2008 1142


