3D DIGITAL INVESTIGATION ON DISEASES OF TIBET MURALS
advertisement
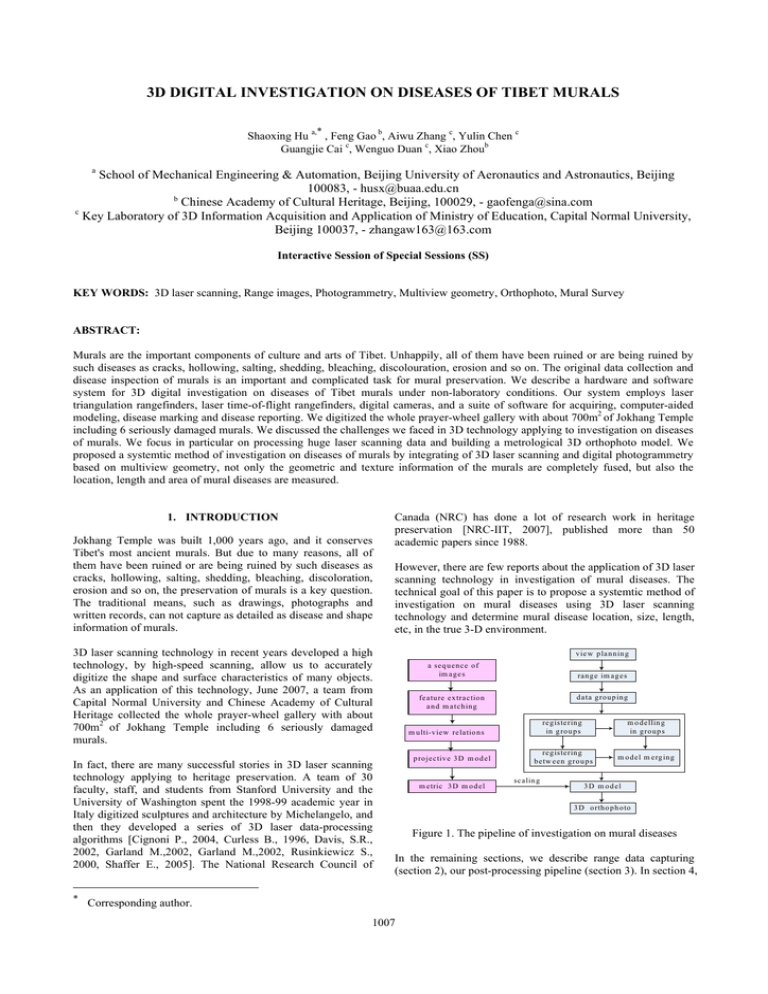
3D DIGITAL INVESTIGATION ON DISEASES OF TIBET MURALS ∗ Shaoxing Hu a, , Feng Gao b, Aiwu Zhang c, Yulin Chen c Guangjie Cai c, Wenguo Duan c, Xiao Zhoub a School of Mechanical Engineering & Automation, Beijing University of Aeronautics and Astronautics, Beijing 100083, - husx@buaa.edu.cn b Chinese Academy of Cultural Heritage, Beijing, 100029, - gaofenga@sina.com c Key Laboratory of 3D Information Acquisition and Application of Ministry of Education, Capital Normal University, Beijing 100037, - zhangaw163@163.com Interactive Session of Special Sessions (SS) KEY WORDS: 3D laser scanning, Range images, Photogrammetry, Multiview geometry, Orthophoto, Mural Survey ABSTRACT: Murals are the important components of culture and arts of Tibet. Unhappily, all of them have been ruined or are being ruined by such diseases as cracks, hollowing, salting, shedding, bleaching, discolouration, erosion and so on. The original data collection and disease inspection of murals is an important and complicated task for mural preservation. We describe a hardware and software system for 3D digital investigation on diseases of Tibet murals under non-laboratory conditions. Our system employs laser triangulation rangefinders, laser time-of-flight rangefinders, digital cameras, and a suite of software for acquiring, computer-aided modeling, disease marking and disease reporting. We digitized the whole prayer-wheel gallery with about 700m2 of Jokhang Temple including 6 seriously damaged murals. We discussed the challenges we faced in 3D technology applying to investigation on diseases of murals. We focus in particular on processing huge laser scanning data and building a metrological 3D orthophoto model. We proposed a systemtic method of investigation on diseases of murals by integrating of 3D laser scanning and digital photogrammetry based on multiview geometry, not only the geometric and texture information of the murals are completely fused, but also the location, length and area of mural diseases are measured. 1. INTRODUCTION Jokhang Temple was built 1,000 years ago, and it conserves Tibet's most ancient murals. But due to many reasons, all of them have been ruined or are being ruined by such diseases as cracks, hollowing, salting, shedding, bleaching, discoloration, erosion and so on, the preservation of murals is a key question. The traditional means, such as drawings, photographs and written records, can not capture as detailed as disease and shape information of murals. Canada (NRC) has done a lot of research work in heritage preservation [NRC-IIT, 2007], published more than 50 academic papers since 1988. However, there are few reports about the application of 3D laser scanning technology in investigation of mural diseases. The technical goal of this paper is to propose a systemtic method of investigation on mural diseases using 3D laser scanning technology and determine mural disease location, size, length, etc, in the true 3-D environment. 3D laser scanning technology in recent years developed a high technology, by high-speed scanning, allow us to accurately digitize the shape and surface characteristics of many objects. As an application of this technology, June 2007, a team from Capital Normal University and Chinese Academy of Cultural Heritage collected the whole prayer-wheel gallery with about 700m2 of Jokhang Temple including 6 seriously damaged murals. In fact, there are many successful stories in 3D laser scanning technology applying to heritage preservation. A team of 30 faculty, staff, and students from Stanford University and the University of Washington spent the 1998-99 academic year in Italy digitized sculptures and architecture by Michelangelo, and then they developed a series of 3D laser data-processing algorithms [Cignoni P., 2004, Curless B., 1996, Davis, S.R., 2002, Garland M.,2002, Garland M.,2002, Rusinkiewicz S., 2000, Shaffer E., 2005]. The National Research Council of ∗ v ie w p la n n in g a seq u en ce o f im ag e s rang e im ag es d ata g ro u p in g featu re ex tractio n a n d m atch in g reg isterin g in g ro u p s m o d ellin g in g ro u p s reg isterin g b etw een g ro u p s m o d el m erg in g m u lti-v iew relatio n s p ro jectiv e 3 D m o d el m etric 3 D m o d el scalin g 3 D m o d el 3 D o rth o p h o to Figure 1. The pipeline of investigation on mural diseases In the remaining sections, we describe range data capturing (section 2), our post-processing pipeline (section 3). In section 4, Corresponding author. 1007 The International Archives of the Photogrammetry, Remote Sensing and Spatial Information Sciences. Vol. XXXVII. Part B5. Beijing 2008 we discuss some of the strategies we developed for dealing with the investigation on diseases of murals. Figure 1 is the pipeline of investigation on mural diseases. precision to the detailed scanned models. We determined the viewing locations as follow: (1) Determine the region of the whole mural with a ruler. (2) Compute the coverage area of each range image, while the scanner is about 0.5m from the mural. 2. ACQUIRING LASER DATA AND IMAGE DATA Since almost entire walls of the prayer-wheel gallery are covered with murals, if only scanning single mural, we cannot know it the position in the prayer-wheel gallery; if fine scanning the whole prayer-wheel gallery, we can hardly the huge scanned data. We employ a data acquisition planning at multi-scale, using 3D laser time-of-flight scanner to capture 3D data of the basic structures of the prayer-wheel gallery, and using 3D laser triangulation scanner to fine scan the seriously damaged murals. All laser scanned data was stored as range image. During data acquiring, view planning is one of important tasks, and it plans the viewpoint locations to determine where to take each individual scan. This requires choosing efficient views that will cover the entire surface area of the structure without occlusions from other objects and without self occlusions from the target structure itself.[Paul S.,2007].For the prayer-wheel gallery, considering its long and narrow structure, the 3D laser time-of-flight scanner stood in the middle of the prayer-wheel gallery, and 360 degree scanned, and we captured the laser scanned data of both sides of the prayer-wheel gallery. The 3D laser time-of-flight scanner was kept horizontal to ground to scan the roof of the prayer-wheel gallery.We decided to overlap adjacent scans from 30% to 40% - enough to align them in software. We could compute the distance between viewpoints based on the above demands. Figure 2 shows a floor level slice of the resulting interior model of the prayer-wheel gallery. In this experiment, scans were merged using reflective targets scattered throughout the environment for registration. viewpoints (3) To align range images in software, while selecting next best view location, an overlap with known regions of at least 30% was kept. Thus, we could plan views that the whole mural needed. Figure 3 shows the data model of a mural using Polyworks to align range images. Figure 3. The data model of a mural using Polyworks to align 208 range images On the other hand, the high resolution colour images contains the rich surface details of the murals, they are the important data source of mural disease analysis. Unhappily, colour images only include 2D information, so generating the measurable 3D orthophotoes are very important for mural disease investigation, protection and restoration. We use a high resolution digital camera with a wide-angle lens to capture the colour images of the murals, and use parallellight to compensate for ambient lighting. While capturing images, we tried our best to ensure that either the horizontal or the vertical direction was taken as a whole, only move the camera along the horizontal or the vertical direction, and form a sequence of images with 60%80% overlap between two adjacent images. 3. COMPUTER-AIDED MODELING After range scans and colour images were acquired, it entered a lengthy post-processing pipeline, whose goal was to produce a measurable 3D orthophoto. 3.1 Laser data processing pipeline Figure 2. The resulting interior model of the prayer-wheel gallery. Top: the position of viewpoints. Down: the part of 3D data of the prayer-wheel gallery The goal of fine scanning the murals was to recognize some diseases including cracks, hollowing, shedding and so on. We employed a 3D laser triangulation scanner with 0.05mm (1) Blocked registration. One significant challenge we faced in this project was the size of our datasets. for example, the point cloud of the mural of figure 3 included 208 range images, each range image contained 305269 points.We addressed this problem by using a blocked method proposed by us. Firstly, all the range images were blocked into different groups, and each group included many range images. The range images were registered in a group, and then the groups were aligned into a common coordinate system. 1008 The International Archives of the Photogrammetry, Remote Sensing and Spatial Information Sciences. Vol. XXXVII. Part B5. Beijing 2008 (2) 3D modelling using regular surfaces and mesh elements. Some geometric details were ignored when we built the basic 3D model of the prayer-wheel gallery so that the prayer-wheel gallery was considered that it is made of planes, smooth surfaces and non-smooth surfaces. We discussed a method of 3D modelling using regular surfaces and mesh elements, its processing pipeline (figure 4) is as follow: a. Range images are segmented into plane regions, smooth surface regions and non-smooth surface regions. b. Create a group of cross-section lines from large-scale smooth surface regions. c. Create another group of cross-section lines, and the two groups of cross-section lines are orthogonal. d. Generate NURBS surfaces by fitting the cross-section lines. e. Create a group of cross-section lines from large-scale plane regions, and generate planes by fitting the cross-section lines. f. Compute the lines of intersection between neighbording planes and surfaces. g. Build meshes from the small smooth surface regions, small plane regions, and the non-smooth surface regions. h. Lastly, get a model closer to CAD applications. camera onto the range scanner and thereby fixing the relative position and orientation of the two sensors with respect to each other [Fr¨uh C., 2003, Sequeira V., 2002, Zhao H.,2003]. Fixing the relative position between the 3D range and 2D image sensors sacrifices the flexibility of 2D image capture. In fact, because of occlusions and self occlusions, the methods above described are not suit to the large-scale scenes. We use a handheld digital camera to take the images from different angles, in different times, in different focal length. It is a technical challenge integrating the images from freely moving cameras with 3D models or 3D point clouds. Some related works have done by [Stamos I., 2008, Zhao W., 2005. ]. I.Stamos’s methods assume the existence of at least two vanishing points in the scene and register individual 2D images onto a 3D model. W. Zhao’s methods align a point cloud computed from the video onto the point cloud directly obtained from a 3D sensor. Our main goal was to create 3D orthophotoes of murals, including (1) generating a big orthophoto for each side wall of the prayer-wheel gallery by aligning a sequence of images onto the range images and (2) producing 3D orthophotoes for each mural by mapping a sequence of images onto a mural model. There are some big holes on the range images of the prayerwheel gallery due occlusions. Using the range images are difficult to model for full of murals. Thereby, we discussed an approach through integrating laser range data with multiview geometry for generating the 3D orthophotoes of the murals and the orthophotoes of each side wall of the prayer-wheel gallery. range images segmentation large-scale smooth surfaces large-scale planes small-scale smooth surfaces and non smooth surfaces We use the following method to create the big orthophotoes for each side wall. creating a group of cross-section lines creating a group of cross-section lines mesh (1) Recover multi-view relations from an image sequence by structure and motion. (2) Compute dense depth map using multi-view stereo. (3) Determine the camera poses by aligning 3D point clouds from the camera and the 3D sensor using ICP (Iterative Closest Point). (4) Generating the measurable orthophotoes. creating another group of cross section lines , and the two groups of cross-section lines are orthogonal generating NURBS surfaces And then, the pipeline of creating the 3D orthophotoes of the murals is shown on figure 1. We need not calculate dense depth map, and only need a basic 3D model of the mural from images according to multi-view geometry. The basic 3D model aligns to the fine 3D model of the mural from high-accuracy laser scanning by ICP. fitting planes solving the intersection lines between neighboring planesand surfaces 4. DISEASES MARKING 3D model closer to CAD applications Figure 4. The pipeline of 3D modelling using regular surfaces and mesh elements (3) Blocked modeling and merging. In the modelling phase, we employed blocked idea to model. The model of each group was created, and then the models were merged a whole model. Figure 5 is the part of the model of the prayer-wheel gallery. 3.2 Image data processing pipeline In practice, the scanned data is not continuous, although contains colour information. 2D images mapping on 3D models is satisfactory for 3D digital investigation on diseases of murals. The traditional methods are realized by rigidly attaching a Mural survey is an indispensable task before mural repairing, and it gives the important data of mural diseases including type, distribution, size, etc. Mural survey provides help for the scientific and effective restoration of the murals. Early surveys of murals, because of material and technical conditions at that time, could only use text and simple graphics to describe the murals. Recently, the more advanced method of using highresolution digital camera to collect the images is widely applied to mural survey. Its processing pipeline is as follow: survey — taking photos — mosaic – importing the panoramic image into AutoCAD — drawing the base map — layered depicting disease. Because mural survey is done in 2D space using this method, this method cannot give the true position and size of mural diseases. We apply 3D orthophotoes to mark the position and size of mural diseases on 3D space. 1009 The International Archives of the Photogrammetry, Remote Sensing and Spatial Information Sciences, Vol. 34, Part XXX Figure 5. The part of the model of the prayer-wheel gallery. (a) (b) (c) (b’) (d) Figure6. The two types of 3D models of the murals By section 2 and section 3, we obtain three types of 3D models of the mural: 3D model without reflectance value, 3D model without reflectance value, 3D orthophoto, and we also get a panoramic of the mural. We could recognize hollows and cracks from 3D model without reflectance value of mural. We could see shedding traces and cracks from 3D model with reflectance value of mural. We could distinguish the more types of diseases from 3D orthophoto. For example, we could see a hollow from figure 6(a), and could not see it from figure 6(b); we could see shedding traces from figure 6(b), and could not see it from 8(b); we could recognize the cracks from figure 6(c) and 6(d). We could see the detailed edge features of the murals from 3D model without reflectance value, just like figure 6(b’). 3D model without reflectance value helps to create the line drawings. Figure 6(a) and 6(b) are the 3D models of a mural from Miscellaneous Tang Temple. Of course, there are many diseases that are recognized by nonprofessionals. Thereby, we asked some professionals to distinguish the more types of diseases from the panoramic of 1010 The International Archives of the Photogrammetry, Remote Sensing and Spatial Information Sciences. Vol. XXXVII. Part B5. Beijing 2008 the mural firstly, and then we marked the diseases using 3D models and 3D orthophotoes of the murals. Figure 7(a) is the disease marks that the professionals drew in 2D panoramic of the mural. It shows type and distribution of mural diseases, but it cannot give true position and true size of mural diseases. Determining true position and true size of mural diseases must depend on 3D model and 3D orthophoto, just like Figure 7(b)-7(d). (a) (b) (c) (d) Figure 7. Diseases marking 5. CONCLUSIONS Mural survey is a complex task, and we have proposed a system for investigation on mural diseases in 3D space using laser scanning and photogrammetry: range image and digital image recording the information of murals. Range images constrain geometry and digital images constrain colour texture. In trying to acquire and post-process laser data and image data, we had to force many difficulties. We discussed the methods of post-processing range data and image data, these methods can be applied to other applications. We presented a method of mapping the images from a hand-held digital camera onto 3D model, and this method is very useful to integrating laser scanning with digital photogrammetry. We verified that integrating laser scanning with digital photogrammetry is one of the important means for mural survey by the investigation on mural diseases of Jokhang Temple. In particular, there were several disappointments. Some images we captured could be used because of image quality questions, and the bigger holes because of occlusions and self occlusions 1011 The International Archives of the Photogrammetry, Remote Sensing and Spatial Information Sciences. Vol. XXXVII. Part B5. Beijing 2008 NRC-IIT, 2007. Visual Information Technology (VIT) Group, http://iit-iti.nrc-cnrc.gc.ca/. were unable to be filled. One of the tangible results of our project is a 3D orthophoto model of Jokhang Temple, the 3D orthophoto of 6 seriously damaged murals, and 3D marking of mural diseases. Paul S.,2007. Data Acquisition and View Planning for 3-D Modeling Tasks. IROS 2007, San Diego, Oct. 29- Nov. 2 Pollefeys M., 2004. Visual Modeling With a Hand-Held Camera. International Journal of Computer Vision, 59(3), pp. 207–232. REFERENCES Blaer P. S., 2006. View Planning for Automated Site Modeling. In IEEE ICRA, 2006. Chen C., 2007. Range Segmentation and Registration for 3D Modeling of Large-Scale Urban Scenes. PhD thesis, City University of New York. Cignoni P., 2004. Aptive tetrapuzzles: Efficient Out-of-core Construction and Visualization of Gigantic Multiresolution Polygonal Models. ACM Trans. on Graphics (SIGGRAPH 2004) , pp. 796–803. Curless B., 1996. volumetric Method for Building Complex Models from Range Images. Proc. SIGGRAPH ’96, ACM, pp. 303-312. Davis, S.R., 2002. Filling holes in complex surfaces using volumetric diffusion. Proc. of the first international symposium on 3D data, visualization and transmission. Fr¨uh C., 2003. Constructing 3D City Models by Merging Aerial and Ground Views. Computer Graphics and Applications, 23(6), pp 52–11. Garland M.,2002. A Multiphase Approach to Efficient Surface Simplification. Proc. of IEEE Visualization. Hartley R., 2003.. Multiple View Geometry in Computer Vision, second edition. Cambridge University Press. Hu,S., 2006. Registration of Multiple Laser Scans Based on 3D Contour Features. Proc. of International Conference on Information Visualisation (IV06). Hu,S.,2005. Real 3D digital method for large-scale cultural heritage sites. Proc. of the Ninth International Conference on Information Visualisation, pp. 503~508 Levoy M., 2000. The Digital Michelangelo Project: 3D Scanning of Large Statues. Proc. of SIGGRAPH 2000, pp. 131– 144. Rusinkiewicz S., 2000. Qsplat: a multiresolution point rendering system for large meshes. Proc. Of SIGGRAPH 2000. Sequeira V., 2002. 3D Rreality Modeling: Photo-realistic 3D Models of Real World Scenes. In Intl. Symposium on 3D Data Processing, Visualization and Transmission, pp.776–783. Shaffer E., 2005. A Multiresolution Representation for Massive Meshes. IEEE Transactions on Visualization and Computer Graphics, 2005,11(2), pp.139–148. Stamos I., 2008. Integrating Automated Range Registration with Multiview Geometry for the Photorealistic Modeling of Large-Scale Scenes. International Journal of Computer Vision [Special Issue on Modeling and Representation of Large-Scale 3D Scenes]. Stamos I., 2006. 3D Modeling Using Planar Segments And Mesh Element. 3rd International Symposium on 3D Data Proc. of Visualization & Transmission, Univesity of North Carolina, Chapel Hill, June 14-16 2006. Zhao H., 2003. Reconstructing a Textured CAD Model of an Urban Environment Using Vehicleborne Laser Range Scanners and Line Cameras. Machine Vision and Applications, 14(1):, pp. 55–41. Zhao W., 2005. Alignment of Continuous Video onto 3D Point Clouds. IEEE Transactions on Pattern Analysis and Machine Intelligence, 27(8), pp. 1305–1318. ACKNOWLEDGEMENTS This work is supported in part by National Natural Science Foundation of China (NSFC 40601081), Beijing Science and Technology Nova project (2006B57) and National Science and Technology Support Program (2006BAJ15B01-02). The work also receives great support from Chinese Academy of Cultural Heritage. 1012
