AN INVESTIGATION OF DIGITAL ORTHOPHOTOS FOR LARGE SCALE MAPPING&CADASTRE RENOVATION
advertisement
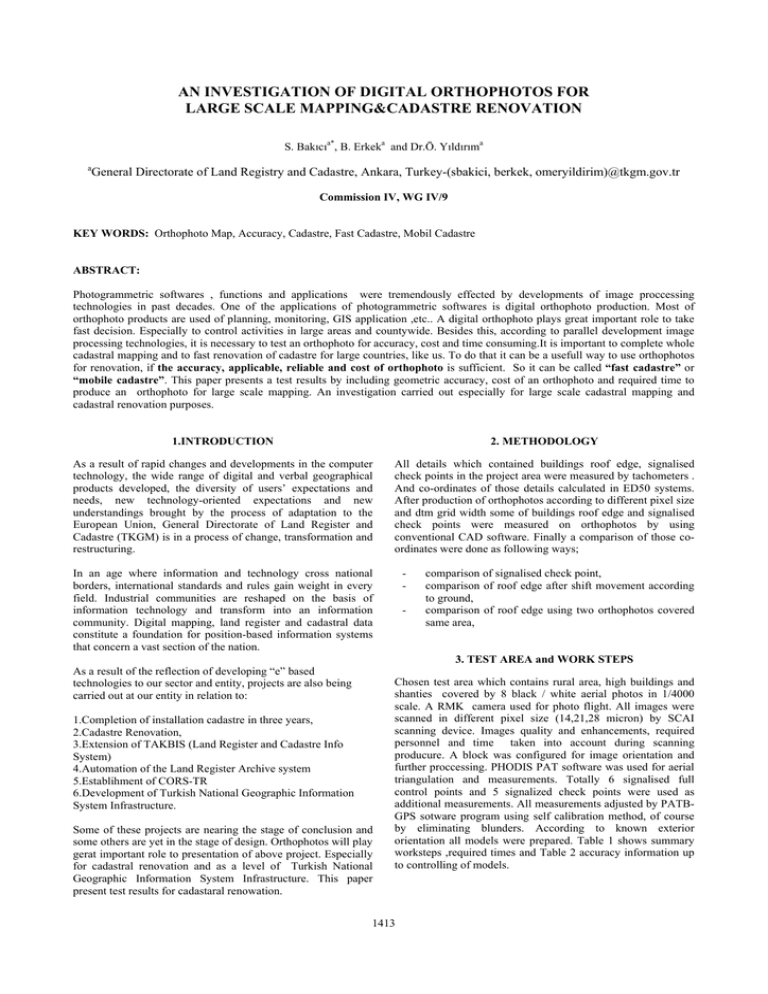
AN INVESTIGATION OF DIGITAL ORTHOPHOTOS FOR LARGE SCALE MAPPING&CADASTRE RENOVATION S. Bakıcıa*, B. Erkeka and Dr.Ö. Yıldırıma a General Directorate of Land Registry and Cadastre, Ankara, Turkey-(sbakici, berkek, omeryildirim)@tkgm.gov.tr Commission IV, WG IV/9 KEY WORDS: Orthophoto Map, Accuracy, Cadastre, Fast Cadastre, Mobil Cadastre ABSTRACT: Photogrammetric softwares , functions and applications were tremendously effected by developments of image proccessing technologies in past decades. One of the applications of photogrammetric softwares is digital orthophoto production. Most of orthophoto products are used of planning, monitoring, GIS application ,etc.. A digital orthophoto plays great important role to take fast decision. Especially to control activities in large areas and countywide. Besides this, according to parallel development image processing technologies, it is necessary to test an orthophoto for accuracy, cost and time consuming.It is important to complete whole cadastral mapping and to fast renovation of cadastre for large countries, like us. To do that it can be a usefull way to use orthophotos for renovation, if the accuracy, applicable, reliable and cost of orthophoto is sufficient. So it can be called “fast cadastre” or “mobile cadastre”. This paper presents a test results by including geometric accuracy, cost of an orthophoto and required time to produce an orthophoto for large scale mapping. An investigation carried out especially for large scale cadastral mapping and cadastral renovation purposes. 1.INTRODUCTION 2. METHODOLOGY As a result of rapid changes and developments in the computer technology, the wide range of digital and verbal geographical products developed, the diversity of users’ expectations and needs, new technology-oriented expectations and new understandings brought by the process of adaptation to the European Union, General Directorate of Land Register and Cadastre (TKGM) is in a process of change, transformation and restructuring. All details which contained buildings roof edge, signalised check points in the project area were measured by tachometers . And co-ordinates of those details calculated in ED50 systems. After production of orthophotos according to different pixel size and dtm grid width some of buildings roof edge and signalised check points were measured on orthophotos by using conventional CAD software. Finally a comparison of those coordinates were done as following ways; In an age where information and technology cross national borders, international standards and rules gain weight in every field. Industrial communities are reshaped on the basis of information technology and transform into an information community. Digital mapping, land register and cadastral data constitute a foundation for position-based information systems that concern a vast section of the nation. - comparison of signalised check point, comparison of roof edge after shift movement according to ground, comparison of roof edge using two orthophotos covered same area, 3. TEST AREA and WORK STEPS As a result of the reflection of developing “e” based technologies to our sector and entity, projects are also being carried out at our entity in relation to: 1.Completion of installation cadastre in three years, 2.Cadastre Renovation, 3.Extension of TAKBIS (Land Register and Cadastre Info System) 4.Automation of the Land Register Archive system 5.Establihment of CORS-TR 6.Development of Turkish National Geographic Information System Infrastructure. Some of these projects are nearing the stage of conclusion and some others are yet in the stage of design. Orthophotos will play gerat important role to presentation of above project. Especially for cadastral renovation and as a level of Turkish National Geographic Information System Infrastructure. This paper present test results for cadastaral renowation. Chosen test area which contains rural area, high buildings and shanties covered by 8 black / white aerial photos in 1/4000 scale. A RMK camera used for photo flight. All images were scanned in different pixel size (14,21,28 micron) by SCAI scanning device. Images quality and enhancements, required personnel and time taken into account during scanning producure. A block was configured for image orientation and further proccessing. PHODIS PAT software was used for aerial triangulation and measurements. Totally 6 signalised full control points and 5 signalized check points were used as additional measurements. All measurements adjusted by PATBGPS sotware program using self calibration method, of course by eliminating blunders. According to known exterior orientation all models were prepared. Table 1 shows summary worksteps ,required times and Table 2 accuracy information up to controlling of models. 1413 The International Archives of the Photogrammetry, Remote Sensing and Spatial Information Sciences. Vol. XXXVII. Part B4. Beijing 2008 1.5 min 3 min 6 min Data Col.Width 2 min Calc Time 2 min EditingTime 2 min Num.of Points 5 min/image 12 min Point/Mesh 5 min/image 8 min Mesh size 5 min/image 5 min Terrain type : Undulating(rural area, DTM area : 600*970 m Shanty and dense DTM app sigma=0.10 m high Buildings) Morphology :NO Smoothing : Medium Average Sea L.:130 m M 50 - - - 247 - 15 50 28 M 30 - - 704 - 40 30 28 M 10 - - - 5950 - 300 10 28 A 50 0.040 48*48 26 273 7 30 5 28 A 30 0.036 48*48 13 714 18 30 5 28 A 10 0.044 19*19 4 6039 Pyramit Calcul. 2 min 4 min 5 min Icon calculation 1 min 1 min 1 min Automatic IO 1 min 1.5 min 2 min 28 Auto. TPM Control&Add. Meas. Bundle Adjust. &I/O Left Epipolar Calculation Right Epipolar CA. L.Epi.Pyramit CA. R.Epi.Pyramit CA. General Control 2.5 min 3.5 min 5 min 7 min 7 min 7 min 6 min 6 min 6 min 4 min 6 min 14 min 4 min 6 min 14 min 1 min 4 min 5 min 1 min 4 min 5 min 1 min 1 min 1 min Table 1. Test block work steps and required times Aprio.sig.image points Aprio.sig.contr. points Apost..sig.image points Apost..sig.cont. points Sigma Naught PlanimetryHight 28 micron PlanimetryHight 21 micron PlanimetryHight 14 micron 5 micron 5 micron 5 micron 2-5 cm 2-5 cm 5-8 cm 11-26 mm 7-15 mm 4-8 mm 40-40 mm 18-18 mm 50-22 mm 36 mm 21 mm 13 mm Intern Accu. 14 micron 270 MB Scan Res. Scanning Control& Enhacements Data Transfer 21 micron 125 MB Grid Width Preparation 28 micron 72 MB DTM Method(M/A) Work Steps - 150 21 A 50 0.038 32*32 21 A 30 0.037 38*38 11 693 17 21 A 10 0.038 32*32 8 6039 150 40 2.5 14 A 14 A 50 0.033 48*48 15 30 0.033 48*48 15 278 714 7 18 80 80 2.5 2.5 14 A 10 0.033 48*48 15 6143 150 80 2.5 8 260 7 30 40 34 2.5 3 Table 3.DTM specification and information 4. CONCLUSION Signalised check points(which describes rural areas) are sufficient for 1:1000 scale. Buildings by shift vector and signalised check points (which describes urban areas) are insufficient for 1:1000 scale building by two OP are sufficient for 1:1000 scale. Table 2. Test block accuracy informations If we have true orthophotos we can measure both terrestrial boundaries and manmade objects such as buildings without using any shift vectors. And this results show us that orthophotos or true orthophotos can be produced very fast, accurately and reliable for not only cadastral application but also updating and maintaining cadastral GIS databases, classifying and mapping pervious and impervious surface areas, identifying wetland areas, updating land use maps, estimating crop yields and health, preparing timber stand inventories, As a default parameters for orthophoto production “pixel by pixel” planning for new construction sites, verifying areas for licensing method for geometry , “bicubic” method for radiometry and and permitting pipeline management ,utilities infrastructure 1:1000 output scale of orthophoto were chosen. Ground resolutions management ,oblique photography for land management and of orthophoto estimated using image scale and scanning resolutions. disaster management. After creating models, digital terrain models were calculated for test area in different grid width (10,30,50 meter) using MATCH-T software. Computing times differs according to scanning resolutions. For example in 14 micron Match-t needs 1.5 hours. In very sense buildings area at least %50 dtm points needs editing. Of course it takes too much time. All edited dtm points were inserted required format to use for orthophoto. Table 3 shows DTM specifications and information. Table 4 shows summary information of produced orthophotos. Finally, general comparison of measured details have been presented at Table 5. 1414 The International Archives of the Photogrammetry, Remote Sensing and Spatial Information Sciences. Vol. XXXVII. Part B4. Beijing 2008 Scanning (micron) Default parameters of orthophotos Scale 1: 1000 Resctification : pixel by pixel Radiometry : bicubic Texture Ground OP size Calculation DTM in OP Resolut. (MB) Time Grid (m) (minute) Width (m) Scan Res. dtm Check P. Buildings rms Buildings by shift ve. rms by two OP GW rms (comp 3) (comp 1) (comp 2) 28 50 0.143 0.21-0.87 28 30 0.117 0.14-0.93 28 10 0.134 0.18-0.69 28 50 0.122 0.17-0.75 28 Good 0.112 45 10 50 28 Good 0.112 45 12 30 28 30 0.100 0.40-0.98 28 0.112 45 20 10 28 10 0.097 ----------- 28 little broken Good 0.112 45 7 50 21 50 0.119 0.21-0.70 28 Good 0.112 45 9 30 21 30 0.025 0.16-0.61 28 Large 0.112 Broken Good 0.084 45 11 10 21 10 0.077 ----------- 80 15 50 14 50 0.087 0.35-1.44 14 30 0.078 0.18-0.43 14 10 0.089 0.19-0.62 21 21 Good 0.084 80 17 30 21 0.084 80 20 10 14 large broken Good 0.05 210 32 50 14 Good 0.05 210 32 30 14 Good 0.05 210 42 10 0.208 0.208 0.152 0.133 Table 5.General comparison of measured details Table 4. Default parameters of orthophotos 1415 The International Archives of the Photogrammetry, Remote Sensing and Spatial Information Sciences. Vol. XXXVII. Part B4. Beijing 2008 1416
