MAPPING AND CARTOGRAPHY OF THE ICY SATURNIAN SATELLITES USING CASSINI-ISS IMAGES
advertisement
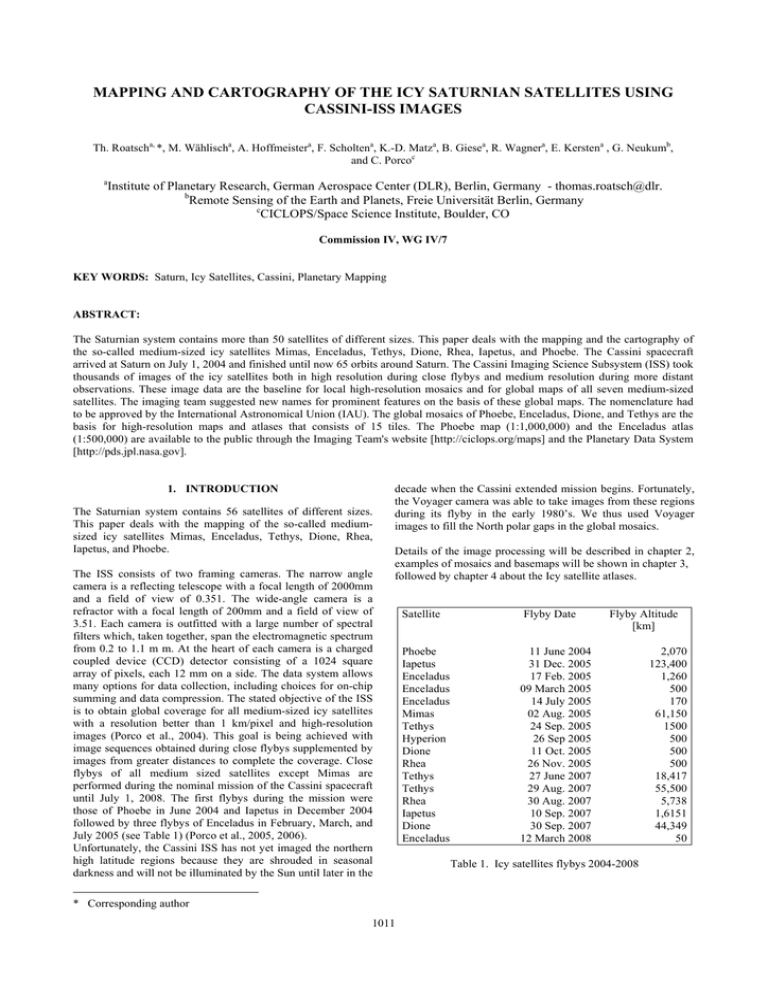
MAPPING AND CARTOGRAPHY OF THE ICY SATURNIAN SATELLITES USING CASSINI-ISS IMAGES Th. Roatscha, *, M. Wählischa, A. Hoffmeistera, F. Scholtena, K.-D. Matza, B. Giesea, R. Wagnera, E. Kerstena , G. Neukumb, and C. Porcoc a Institute of Planetary Research, German Aerospace Center (DLR), Berlin, Germany - thomas.roatsch@dlr. b Remote Sensing of the Earth and Planets, Freie Universität Berlin, Germany c CICLOPS/Space Science Institute, Boulder, CO Commission IV, WG IV/7 KEY WORDS: Saturn, Icy Satellites, Cassini, Planetary Mapping ABSTRACT: The Saturnian system contains more than 50 satellites of different sizes. This paper deals with the mapping and the cartography of the so-called medium-sized icy satellites Mimas, Enceladus, Tethys, Dione, Rhea, Iapetus, and Phoebe. The Cassini spacecraft arrived at Saturn on July 1, 2004 and finished until now 65 orbits around Saturn. The Cassini Imaging Science Subsystem (ISS) took thousands of images of the icy satellites both in high resolution during close flybys and medium resolution during more distant observations. These image data are the baseline for local high-resolution mosaics and for global maps of all seven medium-sized satellites. The imaging team suggested new names for prominent features on the basis of these global maps. The nomenclature had to be approved by the International Astronomical Union (IAU). The global mosaics of Phoebe, Enceladus, Dione, and Tethys are the basis for high-resolution maps and atlases that consists of 15 tiles. The Phoebe map (1:1,000,000) and the Enceladus atlas (1:500,000) are available to the public through the Imaging Team's website [http://ciclops.org/maps] and the Planetary Data System [http://pds.jpl.nasa.gov]. 1. INTRODUCTION The Saturnian system contains 56 satellites of different sizes. This paper deals with the mapping of the so-called mediumsized icy satellites Mimas, Enceladus, Tethys, Dione, Rhea, Iapetus, and Phoebe. The ISS consists of two framing cameras. The narrow angle camera is a reflecting telescope with a focal length of 2000mm and a field of view of 0.351. The wide-angle camera is a refractor with a focal length of 200mm and a field of view of 3.51. Each camera is outfitted with a large number of spectral filters which, taken together, span the electromagnetic spectrum from 0.2 to 1.1 m m. At the heart of each camera is a charged coupled device (CCD) detector consisting of a 1024 square array of pixels, each 12 mm on a side. The data system allows many options for data collection, including choices for on-chip summing and data compression. The stated objective of the ISS is to obtain global coverage for all medium-sized icy satellites with a resolution better than 1 km/pixel and high-resolution images (Porco et al., 2004). This goal is being achieved with image sequences obtained during close flybys supplemented by images from greater distances to complete the coverage. Close flybys of all medium sized satellites except Mimas are performed during the nominal mission of the Cassini spacecraft until July 1, 2008. The first flybys during the mission were those of Phoebe in June 2004 and Iapetus in December 2004 followed by three flybys of Enceladus in February, March, and July 2005 (see Table 1) (Porco et al., 2005, 2006). Unfortunately, the Cassini ISS has not yet imaged the northern high latitude regions because they are shrouded in seasonal darkness and will not be illuminated by the Sun until later in the decade when the Cassini extended mission begins. Fortunately, the Voyager camera was able to take images from these regions during its flyby in the early 1980’s. We thus used Voyager images to fill the North polar gaps in the global mosaics. Details of the image processing will be described in chapter 2, examples of mosaics and basemaps will be shown in chapter 3, followed by chapter 4 about the Icy satellite atlases. * Corresponding author 1011 Satellite Flyby Date Phoebe Iapetus Enceladus Enceladus Enceladus Mimas Tethys Hyperion Dione Rhea Tethys Tethys Rhea Iapetus Dione Enceladus 11 June 2004 31 Dec. 2005 17 Feb. 2005 09 March 2005 14 July 2005 02 Aug. 2005 24 Sep. 2005 26 Sep 2005 11 Oct. 2005 26 Nov. 2005 27 June 2007 29 Aug. 2007 30 Aug. 2007 10 Sep. 2007 30 Sep. 2007 12 March 2008 Flyby Altitude [km] Table 1. Icy satellites flybys 2004-2008 2,070 123,400 1,260 500 170 61,150 1500 500 500 500 18,417 55,500 5,738 1,6151 44,349 50 The International Archives of the Photogrammetry, Remote Sensing and Spatial Information Sciences. Vol. XXXVII. Part B4. Beijing 2008 taken with the filters CL1, CL2 or GRN, as these images show comparable albedo contrasts among different surface terrains. 2. DATA PROCESSING The image data returned from the spacecraft are distributed to the Cassini imaging team in VICAR (Video Image Communication and Retrieval) format [http://wwwmipl.jpl.nasa.gov/external/vicar.html]. The first step of the image processing is the radiometric calibration of the images using the ISS Team’s CISSCAL computer program (Porco et al., 2004). The next step of the processing chain is to map project the images to the proper scale and map format – a process that requires detailed information about the global shape of the satellite. The inner Saturnian satellites are best described by triaxial ellipsoids as derived from ISS images by Thomas et al. (2006). However, to facilitate comparison and interpretation of the maps, ellipsoids were used only for the calculation of the ray intersection points, while the map projection itself was done onto a sphere with the mean radius. The Cassini orbit and attitude data for the calculation of the surface intersection points are provided as SPICE kernels [http://naïf.jpl.nasa.gov] and were improved using a limb-fitting technique (Roatsch et al., 2006). The coordinate system adopted by the Cassini mission for satellite mapping is the IAU ‘‘planetographic’’ system, consisting of planetographic latitude and positive West longitude (Seidelmann et al., 2006). Because a spherical reference surface is used for map projections of the satellites, planetographic and planetocentric latitudes are numerically equal. The Hapke photometric model (Hapke, 1993) was applied to adjust the brightness of each map pixel so that it represents the reflectance that would be observed at the nadir at 30-deg phase angle. Imaging data viewed at incidence and emission angles greater than 80-deg were omitted from the map. After photometric correction, mosaicking is the final step of the image processing (Roatsch et al., 2006). 3-D control nets are common to correct errors in the nominal camera pointing data. Due to the lack of appropriate stereo data, only in the case of the Enceladus mosaic we got acceptable results of the least- squares adjustment. 3. MOSAICS AND BASEMAPS Imaging of the medium-sized icy satellites is ongoing and will continue until the end of the Cassini mission, making it possible to improve the image mosaics during the tour. The basemaps (global mosaics) are usually produced using images of very different resolutions. Effort was made to choose a map resolution in pixel per degree expressible as 2n, where n is an integer. It was not practicable to follow this rule for all basemaps (see Table 2) avoiding a loss of high-resolution image information. The map projection for the basemaps is the equidistant projection centered at 0 degrees longitude. These basemaps cover the whole satellite from -180° till 180° West longitude and from -90° till 90° latitude. However, some areas of the satellites are imaged at very high resolution. These higher resolution images were processed to separate mosaics (see Figure 1 for an example). At the time of writing, thousands of images from the icy satellites are available (e.g. 3073 Enceladus images, 2553 Dione images, and 2000 Tethys images). This total data set contains images obtained through a variety of different ISS color filters and at spatial resolutions ranging from 3 m/pixel up to 14 km/pixel. For our mosaic, we selected only those images For example, 83 Cassini NAC images and two Voyager image were used to produce a 64 pixel/deg global mosaic of Dione (Figure 2). The resolution of the selected Cassini images varies between 0.16 and 1.72 km/pixel whereas the resolution of the Voyager images are 1.45 km/pixel and 6 km/pixel. 4. ICY SATLLITE ATLASES We produced a global printed map of Phoebe in a scale of 1:1,000,000 and atlases of Enceladus (1: 500,000), Dione (1:1,000,000), and Tethys (1:1,000,000) (Table2). Satellite Mean radius Resolution of the used for the digital map map [pixel/ projection degree] [km] Mimas Enceladus Tethys Dione Rhea Iapetus 198.8 252.1 536.3 562.53 764.0 736.0 8 40 32 64 20 16 Phoebe 106.8 8 Map scale of the atlas 1:500.000 1:1,000,000 1:1,000,000 1:3,000,000 (in preparation) 1:1,000,000 Table 2. Resolution and scale of the maps The atlases consist of 15 tiles each of them conform to the quadrangle scheme proposed by Greeley and Batson (1990) and Kirk (1997, 2002, 2003) for large satellites (Figure 3). The scales guarantee a mapping at the highest available Cassini resolution and results in an acceptable printing scale for the hardcopy map of 4.5 pixel/mm. The individual tiles were extracted from the global mosaic and reprojected, coordinate grids were superposed as graphic vectors and the resulting composites were converted to the common PDF-format using the software package Planetary Image Mapper (PIMap) of the Technical University Berlin (Gehrke et al., 2006). The equatorial part of the map (-22° to 22° latitude) is in Mercator projection onto a secant cylinder using standard parallels at -13° and 13° latitude. The regions between the equator region and the poles (-66° to -21° and 21° to 66° latitude) are projected in Lambert conic projection with two standard parallels at -30° and -58° (or 30° and 58°, respectively). The poles are projected in stereographic projection (-90° to -65° latitude and 65° to 90° latitude). The Mercator maps are 72° in longitude dimension, the Lambert maps 90°, and the poles 360°. The individual tiles overlap in the North-South direction by one degree, however no overlapping region is present in the East-West direction (see Figure 3). We have produced the maps using the same scaling factors in overlapping regions at the matching parallels ±21.34° and ±65.19° latitude, 1.0461 and 1.0484 respectively (Snyder, 1987). We also added a resolution map and an index map for every individual tile, showing the image resolution, the image numbers and the location of the images within the individual quadrangle (Roatsch et al., 2008a and b). The Cassini imaging team proposed new names for geological features, in addition to the features already named by the 1012 The International Archives of the Photogrammetry, Remote Sensing and Spatial Information Sciences. Vol. XXXVII. Part B4. Beijing 2008 Voyager team and used in the maps. The locations and dimensions of all previously known features were measured again on the basis of the Cassini data and were corrected when necessary. The nomenclature proposed by the Cassini-ISS team was approved by the IAU [http://planetarynames.wr.usgs.gov/]. In the time of writing the Phoebe map and the Enceladus atlas are available to the public through the Imaging Team's website [http://ciclops.org/maps]. The map tiles have been also archived as standard products in the Planetary Data System (PDS) [http://pds.jpl.nasa.gov/]. REFERENCES Hapke, B., 1993, Theory of Reflectance Spectroscopy (Topics in Remote Sensing, vol. 3), Cambridge University Press, Cambridge, p. 272. Gehrke, S.; Wählisch, M.; Lehmann, H.; et al., 2006: Generation of Topographic and Thematic Planetary Maps Using the Software System “PIMap”. Lunar and Planetary Science XXXVII, Houston, Paper #1322. Greeley, R. and Batson, G., 1990, Planetary Mapping, Cambridge University Press. Kirk, R., 1997, 2002, 2003, Presentations to Cassini Surfaces Working Group. Porco, C. C. and 19 co-authors, 2004, Cassini Imaging Science: Instrument Characteristics and Anticipated Scientific Investigations at Saturn, Space Science Review 115, 363-497. Roatsch, T., Wählisch M., Scholten, F., Hoffmeister, A., Matz K.-D., Denk, T., Neukum G. Thomas, P., Helfenstein, P., and Porco, C., 2006, Mapping of the icy Saturnian satellites: First results from Cassini-ISS, Planetary Space Sciences 54, 1137 – 1145. Roatsch, T., Wählisch, M., Giese, B., Hoffmeister, A., Matz, K.-D., Scholten, F., Kuhn, A., Wagner, R., Neukum, G., Helfenstein, P. and, Porco, C., 2008a, High-resolution Enceladus atlas derived from Cassini-ISS images, Planetary Space Sciences 56, 109-116. Roatsch, T., Wählisch, M., Hoffmeister, A., Matz, K.-D., Scholten, F., Kersten, E.., Wagner, R., Denk, T., Neukum, G., and, Porco, C., 2008b, High-resolution Dione atlas derived from Cassini-ISS images, submitted to Planetary Space Sciences. Seidelmann, P.K., Archinal, B.A., A’hearn, M.F., Conrad, A., Consolmagno, G.J., Hestroffer, D., Hilton, J.L., Krasinsky, G.A., Neumann, G., Oberst, J., Stooke, P., Tedesco, E.F., Tholen, D.J., Thomas, P.C., and Williams, I.P., 2007, Report of the IAU/IAG Working Group on cartographic coordinates and rotational elements: 2006, Celestial Mech Dyn Astr 98, 155– 180. Snyder, J.P., 1987. Map Projections – A Working Manual. US Government Printing Office, Washington, p. 42. Thomas, P.C., Burns, J.A., Helfenstein, P., Squyres, S., Veverka, J., Porco, C., Turtle, E.P., McEwen, A., Denk, T., Giese, B., Roatsch, T., Johnson, T.V., Jacobson, R.A., 2007, Shapes of the Saturnian icy satellites and their significance, Icarus 179, 573-584. Porco, C.C., 34 co-authors, 2005. Cassini imaging science: initial results on Phoebe and Iapetus. Science 307, 1237–1242. Porco, C. C. and 24 co-authors, 2006, Cassini Observes the Active South Pole of Enceladus, Science 311, 1393-1401. ACKNOWLEDGEMENTS The authors acknowledge helpful discussions with J. Blue and R. Kirk (USGS). 1013 The International Archives of the Photogrammetry, Remote Sensing and Spatial Information Sciences. Vol. XXXVII. Part B4. Beijing 2008 Figure 1. High resolution-mosaic of Iapetus (Orthographic projection, map scale = 629 m/pixel, WEST longitude) 1014 The International Archives of the Photogrammetry, Remote Sensing and Spatial Information Sciences. Vol. XXXVII. Part B4. Beijing 2008 Figure 2. Global mosaic of Dione in Simple Cylindrical projection with latitude = 0°,longitude = 0° in the center. 1015 The International Archives of the Photogrammetry, Remote Sensing and Spatial Information Sciences. Vol. XXXVII. Part B4. Beijing 2008 Figure 3. Quadrangle scheme filled with the 15 Enceladus tiles Figure 4. Enceladus map sheet 15 - Damascus Sulcus 1016
