AUTOMATIC ORIENTATION AND MERGING OF LASER SCANNER ACQUISITIONS
advertisement
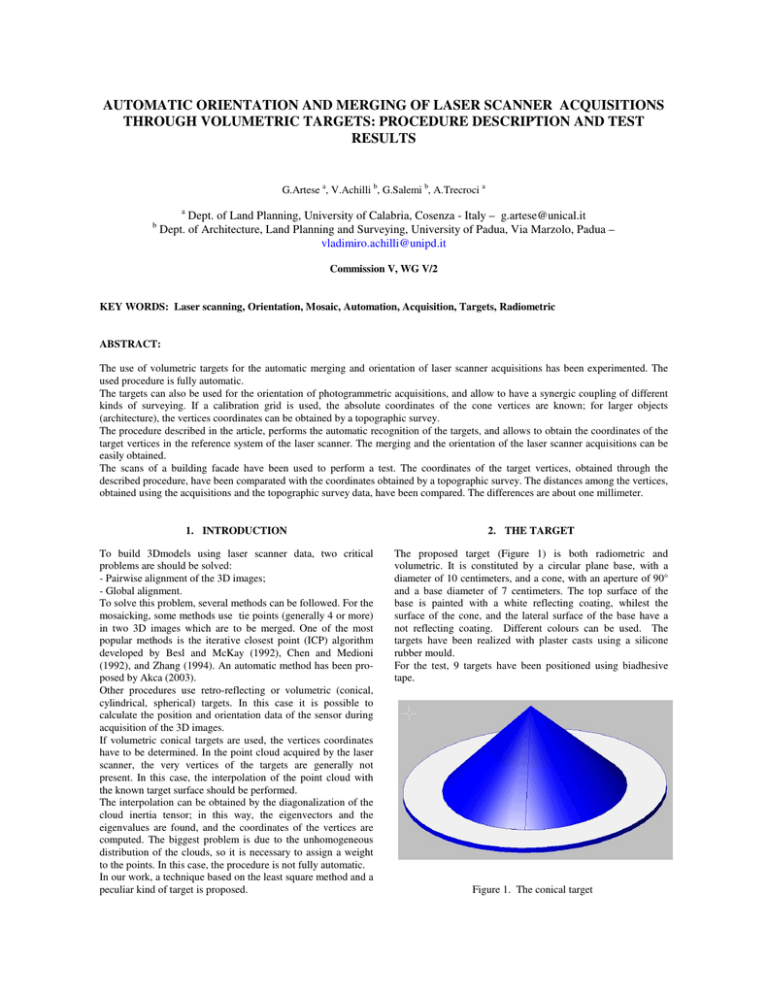
AUTOMATIC ORIENTATION AND MERGING OF LASER SCANNER ACQUISITIONS THROUGH VOLUMETRIC TARGETS: PROCEDURE DESCRIPTION AND TEST RESULTS G.Artese a, V.Achilli b, G.Salemi b, A.Trecroci a a b Dept. of Land Planning, University of Calabria, Cosenza - Italy – g.artese@unical.it Dept. of Architecture, Land Planning and Surveying, University of Padua, Via Marzolo, Padua – vladimiro.achilli@unipd.it Commission V, WG V/2 KEY WORDS: Laser scanning, Orientation, Mosaic, Automation, Acquisition, Targets, Radiometric ABSTRACT: The use of volumetric targets for the automatic merging and orientation of laser scanner acquisitions has been experimented. The used procedure is fully automatic. The targets can also be used for the orientation of photogrammetric acquisitions, and allow to have a synergic coupling of different kinds of surveying. If a calibration grid is used, the absolute coordinates of the cone vertices are known; for larger objects (architecture), the vertices coordinates can be obtained by a topographic survey. The procedure described in the article, performs the automatic recognition of the targets, and allows to obtain the coordinates of the target vertices in the reference system of the laser scanner. The merging and the orientation of the laser scanner acquisitions can be easily obtained. The scans of a building facade have been used to perform a test. The coordinates of the target vertices, obtained through the described procedure, have been comparated with the coordinates obtained by a topographic survey. The distances among the vertices, obtained using the acquisitions and the topographic survey data, have been compared. The differences are about one millimeter. 1. INTRODUCTION 2. THE TARGET To build 3Dmodels using laser scanner data, two critical problems are should be solved: - Pairwise alignment of the 3D images; - Global alignment. To solve this problem, several methods can be followed. For the mosaicking, some methods use tie points (generally 4 or more) in two 3D images which are to be merged. One of the most popular methods is the iterative closest point (ICP) algorithm developed by Besl and McKay (1992), Chen and Medioni (1992), and Zhang (1994). An automatic method has been proposed by Akca (2003). Other procedures use retro-reflecting or volumetric (conical, cylindrical, spherical) targets. In this case it is possible to calculate the position and orientation data of the sensor during acquisition of the 3D images. If volumetric conical targets are used, the vertices coordinates have to be determined. In the point cloud acquired by the laser scanner, the very vertices of the targets are generally not present. In this case, the interpolation of the point cloud with the known target surface should be performed. The interpolation can be obtained by the diagonalization of the cloud inertia tensor; in this way, the eigenvectors and the eigenvalues are found, and the coordinates of the vertices are computed. The biggest problem is due to the unhomogeneous distribution of the clouds, so it is necessary to assign a weight to the points. In this case, the procedure is not fully automatic. In our work, a technique based on the least square method and a peculiar kind of target is proposed. The proposed target (Figure 1) is both radiometric and volumetric. It is constituted by a circular plane base, with a diameter of 10 centimeters, and a cone, with an aperture of 90° and a base diameter of 7 centimeters. The top surface of the base is painted with a white reflecting coating, whilest the surface of the cone, and the lateral surface of the base have a not reflecting coating. Different colours can be used. The targets have been realized with plaster casts using a silicone rubber mould. For the test, 9 targets have been positioned using biadhesive tape. Figure 1. The conical target The International Archives of the Photogrammetry, Remote Sensing and Spatial Information Sciences, Vol. 34, Part XXX 3. THE PROCEDURE Many laser scanners acquire both range and intensity data, so it is possible to detect the points belonging to the bases, by using a radiometric filter (only the points with an intensity greater than a fixed value are selected). In this way, the white base rings are detected. A geometric filter is applied, and the points having a distance from the first “white” one less than the base diameter are selected. With this procedure, the first white ring is isolated (Figure 2). b) A geometric filter is applied to the whole set of data: the points with coordinates differences respect to the center coordinates, less than a fixed value (depending on the target dimensions), are selected. In this way, a point cloud for each target is isolated (Figure 3). Figure 3. Point cloud of a target c) The equation of the cone is very simple in a coordinate system with the z-axis parallel to the cone axis, and the origin in the cone vertex. For this purpose, a rotation is performed (xy plane parallel to the base ring plane – z axis parallel to the cone axis). The point with maximum z value (approximately the vertex) is chosen; a translation is then performed: the point selected in this way lies in the new origin. d) The points of the base, (which distance from the origin is greater than the cone apothem) are excluded; the remaining points should belong to the conical zone of the target (Figure 4). e) The equation of the conic target surface, in the above described local reference system, should be: x2+y2-z2 = 0 Figure 2. Point cloud of a target base ring The same technique is used to obtain the other rings. The point clouds of every single base are so separated. In case a multiresolution scanner is available, a high resolution scan can be performed for every target. If the surveyed object presents highly reflecting points different from the target ones, a supervision is necessary, to avoid wrong detections. If the coordinates of the target vertices are known (i.e. through a topographic survey performed for the orientation), an automatic control on the distances among the targets can be executed. To find the vertices of the targets, a cross correlation between the points belonging to the conical zone and the theoretical cone surface can be executed. Thus, the following operations are performed. a) For each base, the interpolating plane, and its normal direction (approximately the cone axis direction) are obtained. The approximated position of the ring center is found. (1) so a least square procedure is applied. The new coordinates of the points, x’, y’, z’ will be obtained by the equation [X’] = [R] [X] + [δX] (2) where: [X’] is the vector of the new coordinates ; [R] = is the rotation matrix; [δX] = is the translation vector. The components of [δX] are the coordinates of the “very” vertex of the target in the local reference system (Figure 5). f) A reverse rototranslation allows to obtain the coordinates of the “very” vertex, referred to the laser scanner acquisition reference system. Figure 4. The conical zone of a target The merging and pairwise alignment of adjacent 3D images can be easily obtained, using common targets. 4. THE TEST A test has been performed, at the University of Padua. The facade of the Faculty of Engineering has been acquired. For the merging and orientation of the acquisitions, the described targets have been used (Figure 6). Figure 5. The “very” vertex of a target g) The steps a to f are repeated for all targets, and all vertices coordinates are obtained in the same reference system (laser scanner). If a topographic survey has been carried out, an adjustment can be then performed, to impose the geometric congruence of the vertices, and, through a final rototranslation, the absolute coordinates of the whole point cloud are obtained. Figure 6. A target on the building facade Figure 7. The building facade For the test, the Laser Scanner Cyrax 2500 has been used. Its main characteristics are: - single-point range accuracy +/- 4mm - angular accuracy +/- 60 micro-radians - beam spot size 6mm at 50m range - capture speed up to 1,000 points/sec - minimum point-to-point spacing 0.25mm at 50m - horizontal and vertical FOV 40° The targets has been scanned, using the minimum point to point spacing. 5. FIRST RESULTS Figure 8. Targets acquired in both scans Nine targets have been positioned on the facade (Figure 7). Two scans have been carried out. Four targets are present in both scans (Figure 8). The coordinates of the targets have been also measured through a topographic survey, to obtain the orientation, using a Leica TC 2002 total station. To evaluate the effectiveness of the proposed method, the distances among the common targets, obtained using the different scans, have been compared. In the Tables 9 and 10 the distances among the common targets, obtained with the first and the second scan are reported. Table 11 shows the differences between the distances obtained from scans 1 and 2. We can observe that the average difference is about 1 mm, whilest the maximum difference is about 2 mm, less than the scanner accuracy. A second comparison has been performed: the distances among the 9 targets obtained using the scans data, have been compared with the distances obtained using the results of the topographic survey. Distances - Scan 1 (m) Target 4 6 7 5 4 6 3.14215 2.21378 2.00654 2.16967 2.27762 7 5 2.98541 Table 9. Distances among the common targets – Scan 1 4 6 7 5 3.14035 2.21356 2.00545 2.16776 2.27829 2.98538 Table 10. Distances among the common targets – Scan 2 Target 4 6 7 5 Differences between distances (m) 4 6 7 Table 13. Differences between the distances obtained from the second scan and from the topographic survey 6. FUTURE WORK Distances - Scan 2 (m) Target 4 6 7 5 Distances Differences - Topographic/Scan2 (m) Target 4 5 6 7 8 4 5 0.00038 6 -0.00061 -0.00008 7 -0.00026 0.00108 0.00059 8 -0.00133 -0.00123 -0.00150 -0.00122 9 -0.00134 -0.00155 -0.00191 -0.00138 -0.00046 5 0.00180 0.00022 0.00109 0.00191 -0.00067 0.00003 A comparison between the proposed targets and radiometric plane targets will be carried out. Other tests will be performed to evaluate the effectiveness of the method when several mergings are executed. 7. CONCLUSIONS The use of volumetric targets for the automatic merging and orientation of laser scanner acquisitions has been experimented. The targets have been scanned with higher resolution. An automatic procedure for the vertices individuation, based on the least square method, has been proposed. A test has been performed on the facade of the faculty of engineering of the Padua University (Figures 14, 15). The results show errors less than the laser scanner accuracy. Table 11. Differences between distances ( Scan1 – Scan 2) Table 12 shows the differences between the distances obtained from scan 1 and the topographic survey. Table 13 shows the differences between the distances obtained from scan 2 and the topographic survey. It is possible to observe that the average difference is about 1 mm, whilest the maximum difference is about 3 mm (scan 1), and 2 mm (scan 2). Also in this case, the differences are less than the scanner accuracy. Distances Differences - Topographic/Scan1 (m) Target 1 2 3 4 5 6 1 2 -0.00297 3 -0.00040 -0.00042 4 0.00121 -0.00045 -0.00007 5 0.00019 -0.00126 -0.00038 0.00238 6 -0.00187 -0.00311 -0.00252 -0.00130 -0.00187 7 -0.00142 -0.00270 -0.00245 -0.00259 0.00119 0.00210 Table 12. Differences between the distances obtained from the first scan and from the topographic survey Figure 14. View of the central window (multiresolution scan) with the common targets Figure 15. View of a lateral window with the targets 8. REFERENCES Akca, D., 2003. Full automatic registration of laser scanner point clouds http://www.photogrammetry.ethz.ch/general/persons/devrim/TS9_5_A kca_neu.pdf. (accessed 5 Apr. 2004) Besl, P.J., McKay, N.D., 1992. A Method for Registration of 3-D Shapes. IEEE Transactions on Pattern Analysis and Machine Intelligence, 14(2), pp. 239-256 Chen, Y., Medioni, G., 1992. Object Modeling by Registration of Multiple Range Images. Image and Vision Computing, 10(3), pp. 145-155 Zhang, Z., 1994. Iterative Point Matching for Registration of Freeform Curves and Surfaces. International Journal of Computer Vision, 13(2), pp. 119-152.
