GROUND DEFORMATION MAPPING USING INSAR
advertisement
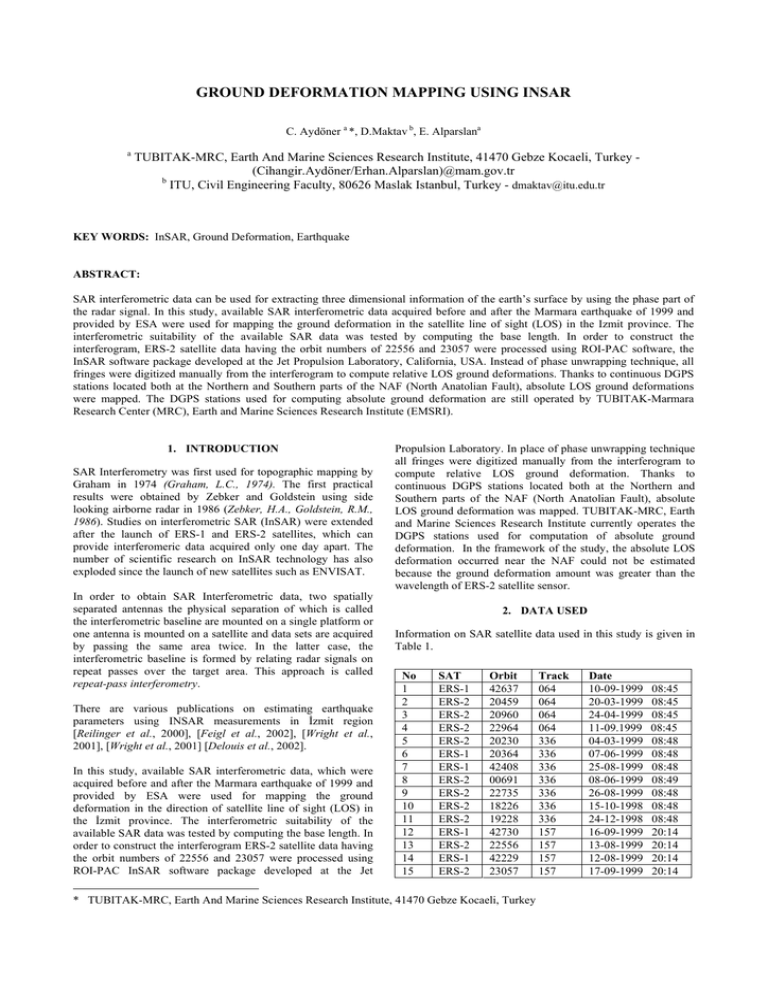
GROUND DEFORMATION MAPPING USING INSAR C. Aydöner a *, D.Maktav b, E. Alparslana a TUBITAK-MRC, Earth And Marine Sciences Research Institute, 41470 Gebze Kocaeli, Turkey (Cihangir.Aydöner/Erhan.Alparslan)@mam.gov.tr b ITU, Civil Engineering Faculty, 80626 Maslak Istanbul, Turkey - dmaktav@itu.edu.tr KEY WORDS: InSAR, Ground Deformation, Earthquake ABSTRACT: SAR interferometric data can be used for extracting three dimensional information of the earth’s surface by using the phase part of the radar signal. In this study, available SAR interferometric data acquired before and after the Marmara earthquake of 1999 and provided by ESA were used for mapping the ground deformation in the satellite line of sight (LOS) in the Izmit province. The interferometric suitability of the available SAR data was tested by computing the base length. In order to construct the interferogram, ERS-2 satellite data having the orbit numbers of 22556 and 23057 were processed using ROI-PAC software, the InSAR software package developed at the Jet Propulsion Laboratory, California, USA. Instead of phase unwrapping technique, all fringes were digitized manually from the interferogram to compute relative LOS ground deformations. Thanks to continuous DGPS stations located both at the Northern and Southern parts of the NAF (North Anatolian Fault), absolute LOS ground deformations were mapped. The DGPS stations used for computing absolute ground deformation are still operated by TUBITAK-Marmara Research Center (MRC), Earth and Marine Sciences Research Institute (EMSRI). 1. INTRODUCTION SAR Interferometry was first used for topographic mapping by Graham in 1974 (Graham, L.C., 1974). The first practical results were obtained by Zebker and Goldstein using side looking airborne radar in 1986 (Zebker, H.A., Goldstein, R.M., 1986). Studies on interferometric SAR (InSAR) were extended after the launch of ERS-1 and ERS-2 satellites, which can provide interferomeric data acquired only one day apart. The number of scientific research on InSAR technology has also exploded since the launch of new satellites such as ENVISAT. In order to obtain SAR Interferometric data, two spatially separated antennas the physical separation of which is called the interferometric baseline are mounted on a single platform or one antenna is mounted on a satellite and data sets are acquired by passing the same area twice. In the latter case, the interferometric baseline is formed by relating radar signals on repeat passes over the target area. This approach is called repeat-pass interferometry. There are various publications on estimating earthquake parameters using INSAR measurements in İzmit region [Reilinger et al., 2000], [Feigl et al., 2002], [Wright et al., 2001], [Wright et al., 2001] [Delouis et al., 2002]. In this study, available SAR interferometric data, which were acquired before and after the Marmara earthquake of 1999 and provided by ESA were used for mapping the ground deformation in the direction of satellite line of sight (LOS) in the İzmit province. The interferometric suitability of the available SAR data was tested by computing the base length. In order to construct the interferogram ERS-2 satellite data having the orbit numbers of 22556 and 23057 were processed using ROI-PAC InSAR software package developed at the Jet Propulsion Laboratory. In place of phase unwrapping technique all fringes were digitized manually from the interferogram to compute relative LOS ground deformation. Thanks to continuous DGPS stations located both at the Northern and Southern parts of the NAF (North Anatolian Fault), absolute LOS ground deformation was mapped. TUBITAK-MRC, Earth and Marine Sciences Research Institute currently operates the DGPS stations used for computation of absolute ground deformation. In the framework of the study, the absolute LOS deformation occurred near the NAF could not be estimated because the ground deformation amount was greater than the wavelength of ERS-2 satellite sensor. 2. DATA USED Information on SAR satellite data used in this study is given in Table 1. No 1 2 3 4 5 6 7 8 9 10 11 12 13 14 15 SAT ERS-1 ERS-2 ERS-2 ERS-2 ERS-2 ERS-1 ERS-1 ERS-2 ERS-2 ERS-2 ERS-2 ERS-1 ERS-2 ERS-1 ERS-2 Orbit 42637 20459 20960 22964 20230 20364 42408 00691 22735 18226 19228 42730 22556 42229 23057 * TUBITAK-MRC, Earth And Marine Sciences Research Institute, 41470 Gebze Kocaeli, Turkey Track 064 064 064 064 336 336 336 336 336 336 336 157 157 157 157 Date 10-09-1999 20-03-1999 24-04-1999 11-09.1999 04-03-1999 07-06-1999 25-08-1999 08-06-1999 26-08-1999 15-10-1998 24-12-1998 16-09-1999 13-08-1999 12-08-1999 17-09-1999 08:45 08:45 08:45 08:45 08:48 08:48 08:48 08:49 08:48 08:48 08:48 20:14 20:14 20:14 20:14 Table-1. Information on SAR satellite data used in this study 3. METHODOLOGY 3.1 Selection of Interferometry Data Pairs Appropriate for SAR Base length values need to be calculated for selection of appropriate data pairs. A base line expressed by the length B and an inclination angle of α between two SAR antennas may also be expressed in horizontal (By), vertical (Bz), perpendicular (B⊥) and parallel (B||) components, as shown in Fig. 1. There exist a number of methods to compute base lengths. Figure-2. Interferogram obtained from the data acquired on 13.08.1999 and 17.09.1999 using the ROIPAC software Phase Unwrapping is one of the techniques employed. An interferogram image directly contains the phase information dependent upon the terrain topography. Since this phase information is given modulus 2π, the integer coefficients of 2π needs to be calculated to determine the ambiguity, which is called, phase unwrapping. Although a variety of methods have been invented for phase unwrapping, which is the most important step in the interferometry technique, none of these gives exact results.[Rüdiger] Figure 1. Interferometric Base Length Expressions Base length values were computed using DESCW program for selection of data pairs suitable for interferometry. Data having base length less than 600m are suitable for SAR interferometry (Gens, R., 1998). Therefore the data of 22556 and 23057 orbit numbers and the data of 42229 and 42730 orbit numbers are suitable for SAR interferometry process. However in this study we only used the data having 22556 and 23057 orbit numbers. For the interferogram image in Figure-2, each fringe was manually digitized as given in Figure 3, instead of using the phase unwrapping technique. Fringes were not clearly obtained on the fault line and its vicinity. There are two reasons for this. First, the deformation rate is probably too high. Second, temporal decorrelation in the rapture zone area is extreme because of the loss of coherence in the damaged areas. Therefore it is essential to make additional observations near the fault to estimate the ground deformation. 3.2 Data Analysis After selection of appropriate data pairs ROIPAC software was used to analyze the data of 22556 and 23057 orbit numbers and the phase difference image depicted in Figure-2 was obtained. Since each fringe in this image corresponds to a deformation of 28 mm, which is half the wavelength, a total of 27 fringes are counted from the Black Sea Coast to the north of the Izmit Bay and the total deformation is calculated as ~75 cm. A number of techniques are then used to obtain the deformation information (deformation in the view direction of the satellite) using this image. TUBI DUMT Figure-3. Fringes manually digitized 3.3 Estimating Absolute LOS Deformation from GPS measurements The slant deformation amount can be computed only in the line of sight of the satellite using radar data. d n , d e , d u , respectively denote deformation components in north, east and vertical directions, dr denotes deformation component in the line of sight of the satellite and obtained from Figure 4 by expression (1) (Hanssen, R.F., 2001). North Sat.orbit. Azimuth Look Direction East Up North du θinc 0.013 TUBI 0.010 0.025 Substituting dn and de deformation values obtained from Table-2 into expression [2], dr component of the specified point is calculated 0.0043244sn for DUMT station and 0.008942sn for TUBI station. If the earth’s radius is assumed R=6361236m, then we compute dr(DUMT)=13.34cm, dr(TUBI)= 27.59cm. Taking these values into consideration, definite deformation values for each fringe digitized from Figure 3 are entered into the database to obtain the absolute deformation map by linear interpolation in the sight of the satellite as shown in Figure 5. However, fringes on and in the vicinity of the fault line were not explicitly obtained because of the insufficiency of the wavelength here. These regions are therefore masked in the deformation map. de Satel. line of sight. 0.010 Table-2. Coordinate values obtained by two GPS stations collecting continuous data. dn αh DUMT dn Azimuth Look East de 0 cm Figure-4. Projection of the three components of the deformation r vector d = ( d n , d e , d u ) onto satellite LOS. (Hanssen, R.F., 2001) 80 cm dr = du cos( θinc) −sin(θinc)[dn cos(αh −3π / 2) +de sin(αh −3π / 2)] (1) Here αh is the azimuth angle of the satellite orbit and is ~190 degrees for the ERS satellite, θinc is the incidence angle of the satellite and is ~23 degrees for ERS. If we consider the fact that the North Anatolian Fault is a strike slip fault, the incidence angle of the satellite is ~23 for ERS, the vertical deformation is 50 cm LOS Fligth Direction 10 cm very small and we can assume d u =0. The amount of deformation in the line of sight of the satellite at such a point may be calculated with the formula below, Figure-5. Ground deformation in the satellite LOS 4. CONCLUSIONS d r = −0.0678d n + 0.3848d e (2) The GPS values collected before and after the Marmara Earthquake of 1999 by two continuous data collecting GPS stations, namely DUMT and TUBI erected in this region by TUBITAK-MRC EMSRI are given in Table-2. Station Deformation dn (sn) de (sn) Until almost fifteen years ago, the scientists were experiencing significant difficulties in application of SAR interferometry potentially in various areas either because the technique is difficult to comprehend in theoretic basis or unavailability of suitable data sets. Although contemporarily significant progress has been made on alleviation of these problems still some problems exist with regard to phase unwrapping. Therefore, the interferogram obtained in this study was visually interpreted and the fringes were manually digitized in order to obtain more correct results. Since LOS deformations obtained from digitized fringes are of relative nature, GPS measurements were used in computation of absolute deformations. In conclusion, the deformation map obtained int the sight of the satellite can be used as a data coverage in various applications, particularly in settlement suitability analysis. 5. ACKNOWLEDGEMENT We would like to express our sincerest thanks to Assoc. Prof. Dr. Semih Ergintav and Ms. Rahşan Çakmak of TUBITAKMRC’s EMSRI for their valuable contribution to this study by supply of data at DUMI and TUBI continuous GPS data collection stations, without which this study would never have been completed. 6. REFERENCES Delouis, B., B. Giardini, P. Lundgren, and J. Salichon, 2002. Joint inversion of INSAR, GPS, teleseismic, and strong motion data for the spatial and temporal distribution of earthquake slip: application to the Izmit mainshock, Bull. Seism. Soc. Amer., in press. Feigl, K.L., F. Sarti, H. Vadon, P. Durand, S. Mclusky, S. Ergintav, R. Bürgmann, A. Rigo, D. Massonnet, and R. Reilinger, 2002. Estimating slip distribution for the Izmit mainshock from coseismic GPS, ERS-1, RADARSAT and SPOT measurements, Bull. Seism. Soc. Amer., in press. Gens, R., J.L. Van Genderen, 1996. Review article: Sar interferometry--issues, techniques, applications. International Journal for Remote Sensing, 17(10):1803-1835. Gens, R., 1998. Quality assessment of SAR interferometric data, PhD thesis, Universität Hannover, 1998. ITC publication Nr.61 Graham, L.C., 1974. Synthetic Interferometer Radar for Topographic Mapping, Proceedings of the IEEE, vol.62, no.6, pp.763. Hanssen, R.F., 2001. Radar Interferometry: Data Interpretation and Error Analysis, Kluwer Academic Publishers, Dordrecht, pp.161-193. Reilinger, R.E., S. Ergintav, R. Bürgmann, S. McClusky, O. Lenk, A. Barka, O. Gurkan, L. Hearn, K.L. Feigl, R. Cakmak, B. Aktug, H. Ozener, and M.N. Toksoz, 2000. Coseismic and postseismic fault slip for the 17 August 1999, M=7.4, Izmit, Turkey earthquake, Science, 289, 1519-1524 Wright, T.J., E.J. Fielding, B.E. Parsons, and P.C. England, 2001. Triggered slip: observations of the 17 August 1999 Izmit (Turkey) earthquake using radar interferometry, Geophys. Res. Lett., 28, 1079-1082. Zebker, H.A., Goldstein, R.M., 1986. Topographic Mapping from Interferometric Synthetic Aperture Radar Observations, J.Geophys.Res., vol.91, no.B5, pp.4993-4999.
