Introduction Results
advertisement
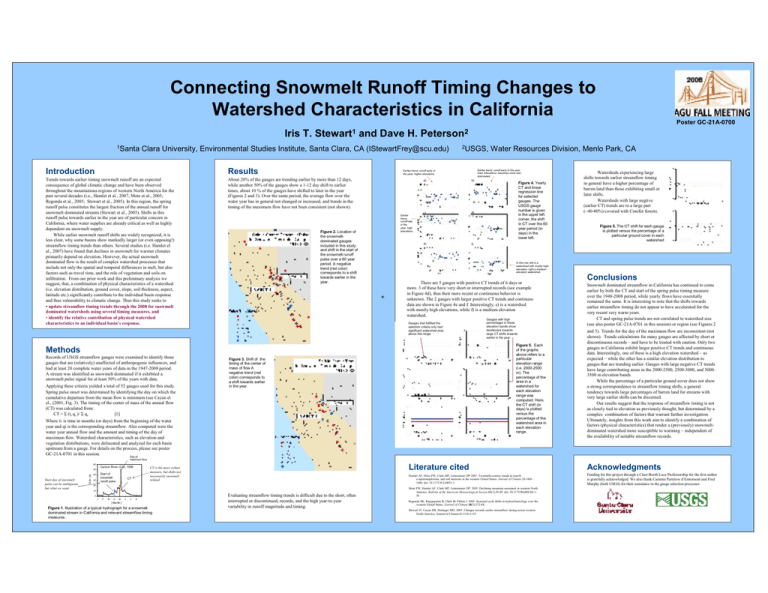
Connecting Snowmelt Runoff Timing Changes to Watershed Characteristics in California Poster GC-21A-0700 Iris T. Stewart1 and Dave H. Peterson2 1Santa Clara University, Environmental Studies Institute, Santa Clara, CA (IStewartFrey@scu.edu) Introduction Results Trends towards earlier timing snowmelt runoff are an expected consequence of global climatic change and have been observed throughout the mountainous regions of western North America for the past several decades (i.e., Hamlet et al., 2007; Mote et al., 2005; Regonda et al., 2005; Stewart et al., 2005). In this region, the spring runoff pulse constitutes the largest fraction of the annual runoff for snowmelt dominated streams (Stewart et al., 2005). Shifts in this runoff pulse towards earlier in the year are of particular concern in California, where water supplies are already critical as well as highly dependent on snowmelt supply. While earlier snowmelt runoff shifts are widely recognized, it is less clear, why some basins show markedly larger (or even opposing!) streamflow timing trends than others. Several studies (i.e. Hamlet el al., 2007) have found that declines in snowmelt for warmer climates primarily depend on elevation. However, the actual snowmelt dominated flow is the result of complex watershed processes that include not only the spatial and temporal differences in melt, but also factors such as travel time, and the role of vegetation and soils on infiltration. From our prior work and this preliminary analysis we suggest, that, a combination of physical characteristics of a watershed (i.e. elevation distribution, ground cover, slope, soil thickness, aspect, latitude etc.) significantly contribute to the individual basin response and thus vulnerability to climatic change. Thus this study seeks to • update streamflow timing trends through the 2008 for snowmelt dominated watersheds using several timing measures, and • identify the relative contribution of physical watershed characteristics to an individual basin’s response. About 20% of the gauges are trending earlier by more than 12 days, while another 50% of the gauges show a 1-12 day shift to earlier times, about 10 % of the gauges have shifted to later in the year (Figures 2 and 3). Over the same period, the average flow over the water year has in general not changed or increased, and trends in the timing of the maximum flow have not been consistent (not shown). 2USGS, Figure 2. Location of the snowmeltdominated gauges included in this study and shift in the start of the snowmelt runoff pulse over a 60 year period. A negative trend (red color) corresponds to a shift towards earlier in the year. a) b) c) d) e) Applying these criteria yielded a total of 52 gauges used for this study. Spring pulse onset was determined by identifying the day on which the cumulative departure from the mean flow is minimum (see Cayan et el., (2001, Fig. 3). The timing of the center of mass of the annual flow (CT) was calculated from: CT = Σ (ti q i )/ Σ qi [1] Figure 4. Yearly CT and linear regression line for selected gauges. The USGS gauge number is given in the upper left corner, the shift in CT over the 60 year period (in days) in the lower left. + There are 5 gauges with positive CT trends of 6 days or more. 3 of these have very short or interrupted records (see example in Figure 4d), thus their more recent or continuous behavior is unknown. The 2 gauges with larger positive CT trends and continuos data are shown in Figure 4e and f. Interestingly, e) is a watershed with mostly high elevations, while f) is a medium elevation watershed. Gauges that fulfilled the selection criteria only had significant watershed area above this range Gauges with high percentages in these elevation bands show tendencies towards large CT shifts towards earlier in the year. Figure 5. Each of the graphs above refers to a particular elevation range (i.e. 2000-2500 m). The percentage of the area in a watershed for each elevation range was computed. Here, the CT shift (in days) is plotted versus the percentage of the watershed area in each elevation range. Figure 3. Shift of the timing of the center of mass of flow A negative trend (red color) corresponds to a shift towards earlier in the year. Where ti is time in months (or days) from the beginning of the water year and qi is the corresponding streamflow. Also computed were the water year annual flow and the amount and timing of the day of maximum flow. Watershed characteristics, such as elevation and vegetation distributions, were delineated and analyzed for each basin upstream from a gauge. For details on the process, please see poster GC-21A-0701 in this session. Day of Watersheds experiencing large shifts towards earlier streamflow timing in general have a higher percentage of barren land than those exhibiting small or later shifts. Watersheds with large negtive (earlier CT) trends are to a large part (~40-80%) covered with Conifer forests. Figure 5. The CT shift for each gauge is plotted versus the percentage of a particular ground cover in each watershed f) In this row, left is a watershed with mostly highelevation, right a mediumelevation watershed. Methods Records of USGS streamflow gauges were examined to identify those gauges that are (relatively) unaffected of anthropogenic influences, and had at least 20 complete water years of data in the 1947-2008 period. A stream was identified as snowmelt dominated if it exhibited a snowmelt pulse signal for at least 50% of the years with data. Earlier trend, runoff early in the year, med. Elevations, becomes more raindominated Earlier trend, runoff early in the year, higher elevations Earlier trend, runoff late in the year, high elevations Water Resources Division, Menlo Park, CA Conclusions Snowmelt dominated streamflow in California has continued to come earlier by both the CT and start of the spring pulse timing measure over the 1948-2008 period, while yearly flows have essentially remained the same. It is interesting to note that the shifts towards earlier streamflow timing do not appear to have accelerated for the very recent very warm years. CT and spring pulse trends are not correlated to watershed size (see also poster GC-21A-0701 in this session) or region (see Figures 2 and 3). Trends for the day of the maximum flow are inconsistent (not shown). Trends calculations for many gauges are affected by short or discontinuous records – and have to be treated with caution. Only two gauges in California exhibit larger positive CT trends and continuous data. Interestingly, one of these is a high elevation watershed – as expected – while the other has a similar elevation distribution to gauges that are trending earlier. Gauges with large negative CT trends have large contributing areas in the 2000-2500, 2500-3000, and 30003500 m elevation bands. While the percentage of a particular ground cover does not show a strong correspondence to streamflow timing shifts, a general tendency towards large percentages of barren land for streams with very large earlier shifts can be discerned. Our results suggest that the response of streamflow timing is not as closely tied to elevation as previously thought, but determined by a complex combination of factors that warrant further investigation. Ultimately, insights from this work aim to identify a combination of factors (physical characteristics) that render a (previously) snowmeltdominated watershed more susceptible to warming – independent of the availability of suitable streamflow records. maximum flow 60 Carson River (CA), 1996 CT is the more robust measure, but shifts not necessarily snowmelt related Start day of snowmelt pulse can be ambiguous, but what we want Q [m 3/s] 50 Start of snowmelt runoff pulse 40 30 CT Literature cited Acknowledgments Hamlet AF, Mote PW, Clark MP, Lettenmaier DP 2007. Twentieth-century trends in runoff, evapotranspiration, and soil moisture in the western United States. Journal of Climate 20:1468 – 1486. doi: 10.1175/JCLI4051.1 Funding for this project through a Clare Booth Luce Professorship for the first author is gratefully acknowledged. We also thank Cammie Partelow d’Entremont and Fred Murphy (both USGS) for their assistance in the gauge selection processes. 20 10 0 J F M A M J J A [ Month ] Figure 1. Illustration of a typical hydrograph for a snowmelt dominated stream in California and relevant streamflow timing measures. Evaluating streamflow timing trends is difficult due to the short, often interrupted or discontinued, records, and the high year-to-year variability in runoff magnitude and timing. Mote PW, Hamlet AF, Clark MP, Lettenmaier DP. 2005. Declining mountain snowpack in western North America. Bulletin of the American Meteorological Society 86(1):39-49. doi: 10.1175/BAMS-86-139 Regonda SK, Rajagopalan B, Clark M, Pitlick J. 2005. Seasonal cycle shifts in hydroclimatology over the western United States. Journal of Climate 18(2):372-84. Stewart IT, Cayan DR, Dettinger MD, 2005. Changes towards earlier streamflow timing across western North America. Journal of Climate18:1136-1155
