Glacier Shrinkage and Effects on Alpine Hydrology
advertisement

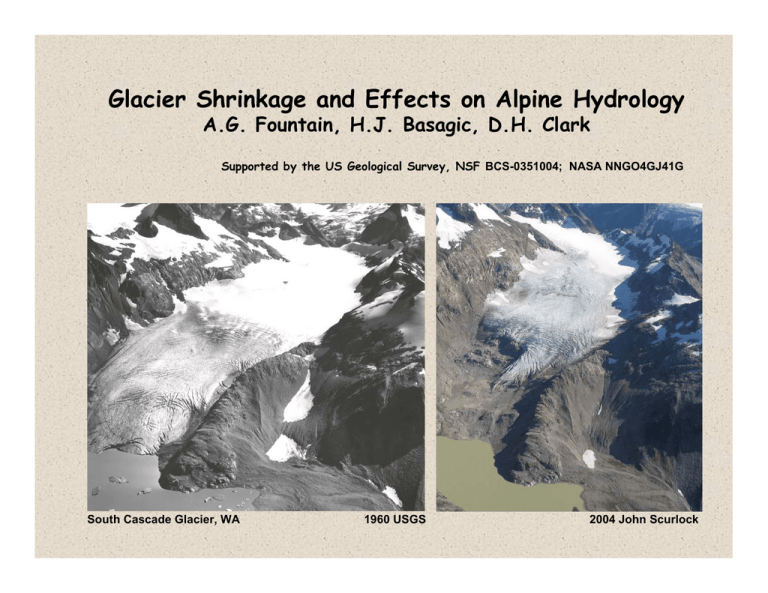
Glacier Shrinkage and Effects on Alpine Hydrology A.G. Fountain, H.J. Basagic, D.H. Clark Supported by the US Geological Survey, NSF BCS-0351004; NASA NNGO4GJ41G South Cascade Glacier, WA 1960 USGS 2004 John Scurlock Glacier Effects on Basin Runoff Variability Runoff Delay Timing of peak runoff Peak Delay Fountain and Tangborn, 1985 Limit of Downstream Effects Matt Hoffman L* Number of Glaciers in the American West ~1712 National Park Service lands 192 1225 US Forest Service lands Glaciers 23 191 34 52 1 Total Glacier Area ~553 km2 National Park Service lands 49.9 417 US Forest Service lands Glaciers 18.5 54.1 2.1 11.5 0.1 Cummulative Number of Glaciers Size Distribution of Glaciers Rocky Mountain National Park 10000 1000 100 10 1 0.1 1.0 10.0 100.0 Area (km2) (km2) 1000 Frequency (number) 900 800 700 600 500 400 300 200 100 0 0.1 0.3 0.6 1.0 1.6 2.0 2.5 3.2 4.0 5.0 6.3 8.0 10 13 16 Area (km2) (km2) South Cascade Glacier, 1960 Glacier Shrinkage Tyrolian data courtesy of F. Paul Geography, University Zurich-Irchel Grinnell Glacier Glacier National Park, 1938 - 1998 1938 T.J. Hileman 1998 D. Fagre Bahr and Meier 1000 3.0 2.5 2.0 100 1.5 1.0 10 0.5 0.1 1.0 10.0 0.0 100.0 1000 900 1.0 0.9 800 700 0.8 0.7 600 500 400 0.6 0.5 0.4 300 200 0.3 0.2 100 0 0.1 0.0 0.1 0.3 0.6 1.0 1.6 2.0 2.5 3.2 4.0 5.0 6.3 8.0 10 13 16 2 Area(km (km2) Area ) Total Volume Loss (m weq) 2 Area (km (km2) Area ) km3 3.5 Cummulative Volume Loss 4.0 1 Number Total Glacier Volume Loss Cummulative Number of Glaciers 10000 Colorado Front Range - John Achuff Norrland Sweden Approximate Values of Glacier Change 1960’s to current National Park North Cascades Mount Rainier Olympic Yosemite-Sequoia -Kings Glacier Rocky Mountain Number of Glaciers 321 100 (26) 165 Area km2 117 ±1 93 34 Δ Area km2 Δ Volume km3 m -8 ±1 -2 -2 -0.8 ±0.1 -0.18 -0.07 7 2 2 45 6 -2 -0.03 5 127 33 -3 -0.08 2 -0.3 -0.003 2 28 1.4 Wheeler Peak Great Basin National Park Matt Hoffman Matt Hoffman Matt Hoffman Rock Glacier Distribution National Park Service lands US Forest Service lands ? Glaciers Regions with debriscovered Glaciers ? ? Matt Hoffman Rock Glaciers / Buried Ice (population not well known, effects not well known) Clean glacier Rock-covered glacier L. Mattson Mount Sopris, CO Conclusions 1. Hydrologic influence (variability, delay of seasonal peak) imposed by glaciers extend roughly 5 glacier “lengths” downstream. Effects melt volume and water quality can extend much further. 2. The “small” glaciers (<1 km2) account for almost half of the glacier area in the west and half of the melt water volume. They seem to be changing the most, yet are the least studied and hardest to define. 3. Debris-covered glaciers appear to be very common and are largely unrecognized sources of melt water. They may effectively double the area of ice present in a given region.


