Document 11822260
advertisement

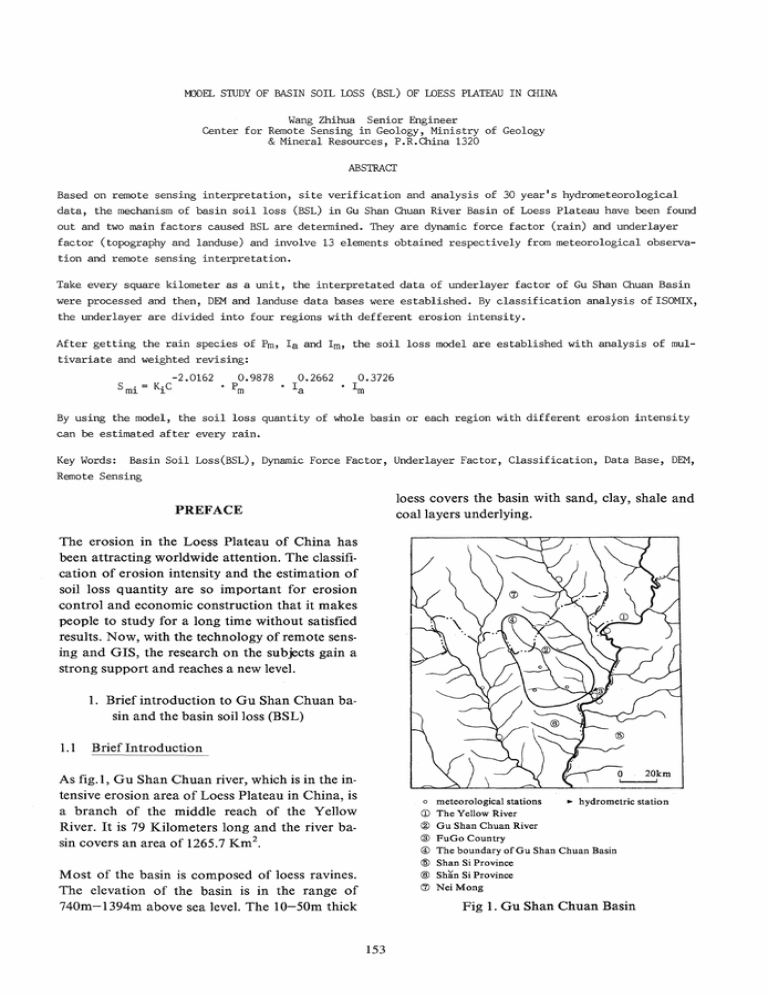
MJDEL STUDY OF BASIN SOIL LOSS (BSL) OF LOESS PLATEAU IN anNA Wang Zhihua Senior Engineer Center for Remote Sensing in Geology, Ministry of Geology & Mineral Resources, P.R.China 1320 ABSTRACT Based on remote sensing interpretation, site verification and analysis of 30 year's hydrometeorological data, the mechanism of basin soil loss (BSL) in Gu Shan Chuan River Basin of Loess Plateau have been found out and two main factors caused BSL are determined. They are dynamic force factor (rain) and underlayer factor (topography and landuse) and involve 13 elements obtained respectively from meteorological observation and remote sensing interpretation. Take every square kilometer as a unit, the interpretated data of underlayer factor of Gu Shan Chuan Basin were processed and then, DEM and landuse data bases were established. By classification analysis of ISOMIX, the underlayer are divided into four regions with defferent erosion intensity. After getting the rain species of Pm, Ia and 1m, the soil loss model are established with analysis of multivariate and weighted revising: 0.9878 0.2662 0.3726 • Pm • Ia • 1m By using the model, the soil loss quantity of whole basin or each region with different erosion intensity can be estimated after every rain. Key Words: Basin Soil Loss(BSL), Dynamic Force Factor, Underlayer Factor, Classification, Data Base, DEM, Remote Sensing loess covers the basin with sand, clay, shale and coal layers underlying. PREFACE The erosion in the Loess Plateau of China has been attracting worldwide attention. The classification of erosion intensity and the estimation of soil loss quantity are so important for erosion control and economic construction that it makes people to study for a long time without satisfied results. Now, with the technology of remote sensing and GIS, the research on the subjects gain a strong support and reaches a new level. 1. Brief introduction to Gu Shan Chuan basin and the basin soil loss (BSL) 1.1 Brief Introduction As fig.I, Gu Shan Chuan river, which is in the intensive erosion area of Loess Plateau in China, is a branch of the middle reach of the Yellow River. It is 79 Kilometers long and the river basin covers an area of 1265.7 Km 2 . o meteorological stations ... hydrometric station CD The Yellow River ® Gu Shan Chuan River @ FuGo Country @ The boundary of Gu Shan Chuan Basin @ Shan Si Province Most of the basin is composed of loess ravines. The elevation of the basin is in the range of 740m-I394m above sea level. The IO-50m thick ® Shan Si Province (J) Nei Mong Fig 1. Gu Shan Chuan Basin 153 There are 6 meteorological stations distributed in the basin and a hydrometric station near the river mouth. 1.2 2.2 Topography, landuse-underlayer factor The underlayer factor affecting BSL mainly includes 4 types of subfactors which consist dozens of elements. The 4 subfactors are the anti-erosion property of the surface material, the topography, the land cover and the recent tectonic motion. If all subfactors were in the BSL model, that would be very complex. The factors must be simplified. By site investigation and analysis of a great number of data, two main underlayer subfactors- topography and landuse, are generized from above mentioned 4 subfactors. Since the other two factors, tectonic and anti-erosion property, are closely related with topograph, they can be replaced by it. BSL BSL means the quantity of soil loss measured near the river mouth. It is the result of processes of rain- erosion- soil transportation in the basin area. Owing to that the transmission ratio of the suspended soil in loess plateau is about 1, the quantity of the transmission soil measured near the mouth is approaching to that of the soil erosion of the whole basin. BSL in Gu Shan Chuan possesses the typical properties of the Loess Plateau as follows: 2.2.1 Topography CD rain and its run off is the main dynamic force The topographic factor affecting BSL can be devided into 4 elements: slope (SL), shady slope ratio (Sh), gully density (Gde) and gully depth (Gd). The study indicate that BSL will strengthen with the increase of SL (0 0 -- 28 0 ) , Sh, Gde and Gd in the BSL process. of BSL. So absolute majority BSL occurs in the rain season. ® The quantity of BSL is very unstable and far more changeable than rain. 2. The Environment Factors Affecting BSL 2.2.2 Landuse. The landuse factor is devided into 6 elements, expressed as A, B, C, D, E and F. The environment factors affecting BSL. at Gu Shan Chuan can be summarized into two types: rain-dynamic. force factor and topography, land use-under layer factor. A-over 30% land covered with arbor or bush B-constructive basic farm land C-natural or artificial grass land D-steep slope plough land E-bare loess land F-water body, river, lake, reservior •••. In fact, both topography and landuse factors have already reflected the influence of nature and human activity on Loess erosion. 2.1 Rain-dynamic force factor As mentioned above rain is the main dynamic force for BSL. By analysing the 30 year's data of rain-hydrometric records and multivariate statistics the specific elements of rain affecting BSL are determined as shown in following: Pm-the precipitation until the rain intensity is less than 4mm / h. la-the average intensity of rain 1m-the maximum intensity of rain 3. Analysis of the process of soil loss 3.1 There is only a general activity pattern or tendency of BSL The analysis indicates that when Pm < 10mm, la < 1.2mm / h and 1m < 4mm / h, the rain, called non-BSL rain, causes no obvious BSL. Otherwise, it is called BSL rain. Only BSL rain, is discussed in this paper. The process of BSL consists of soil erosion occurrence, soil transportation and measurement of soil loss in the river mouth. Lots of factors (mentioned above), as well as some random factors 154 4.1 Data collecting and preprocessing such as landslide, mudflow eruptting, vegetation destruction or reforest, rush or silt of the river ••• , take part in the BSL process. Therefore, it is a very complex and variable course. For convenience, Gu Shan Chuan basin is devided into a net of lkm x lkm unit. All underlayer factors are digitized by the unit. Before BSL modeling LP(Loess Plateau)GIS included DEM and landuse data base are established. Thus, it is very difficult to establish a model to reflect the process involving so many factors, but in general, the BSL can be considered as a process that rain-the dynamic force acts upon the underlayer and causes soil loss. Simply to say, this is the process of input-output. Basin is a natural system which accepts rain, forms run off, occurs erosion and transports soil. In the scope of basin, the activities of rain, run off, erossion and soil tranportaion possess some patterns and certain trail. Therefore, the basic relation among them is something certain too. And it is possible to propose a basic BSL structure which is based on the general relationship and activity patterns. The model can be determined by statistical analysis. 4.l.1 Topogrophy factor DEM (digit elevation model) of Gu Shan Chuan is collected from DEM data base of LPGIS and then processed. The data of SL / km 2, Sh / km 2, Gde / km 2and Gd / km 2 are obtained. 4.1.2 Landuse factor Landuse data is collected from landuse data base of LPGIS and the occupied squares of A, B, C, D, E and F in every km 2 are obtained by calculation. 3.2 Rain and underlayer factor have different characteristics in the BSL process respectively. 4.1.3 Rain factor Underlayer factor is a relative stable (no changes with time) and passive (soil loss triggering off only by rain) factor, and it determines the erosion intensity in different place for the same rain. From 54 rain records during 1977-1983, the Pm, la' 1m of every rain are acquired. By means of interpolation of second degree curved surface, the Pm / km 2, la / km 2 , 1m / km 2 and the rain covered area (SR) are obtained. But, rain is an active factor. The occurance and variance of BSL are mainly caused by rain. 4.2 The model of grading basin erosion intensity Therefore, the formula that takes the rain factor as an independent variable and underlayer factor as a constant can match every property. We consider S=C·R as the basic structure of BSL. 3.3 The (pm,~, relationship of each rain 1m) in the process of BSL With mothed of ISOMIX combined with real conditions, all the underlayer factors of Gu Shan Chuan basin which have been preprocessed are devided into 4 grades of erosion intensity: most intense (266.0 km 2), intense (564.3 km 2), middle (429.5km 2) and weak (6.0km 2). This is a relative grading model. (1) element 4.3 The model establishment ofBSL Rain causes BSL which enlarges the variance of rain,as a result, e.g. more concentrated and with a larger quantity change. Therefore, it is infered that each rain element should be multiplicated in the BSL process i.e. R '"-' Pm • la • 1m. 4.3.1 The average erosion modulus of BSLSm According to 3.2, 3.3 we have: (2) 4. Establishment of BSL Model 155 Sm: average erosion modulus Co, C h C 2, C 3: undetermined coefficient For 54 rain, we have 54 formulas of (2). 4 S = f..J ~ Si. ~ S Ri ml i=l By multivariate regression, Sm can be obtained. Sm =e - 2.0126 .. P 0.9878 m • /0.2662 a • / 0.3726 m The results of calculate and real measured BSL of Gu Shan Chuan for 54 rain (1977,-1983) shows as table 1. (3) 5. Conclusion F test of significance: CD By cone~ting D EM and landuse data from the data base of LPG1S and preprocessing the data with lSOMIX, the basin can be devided into different erosion grades. 0:=0.01 Fcl4, 54-4-1)05 2.06 Fco= 39.7499, FCI = 80.0368, F C2 = 2.4563, F c3 = 3.1795 Thus formula (3) significant. ~ 4.3.2 The erosion modulus of each erosion region- Smi and weighted coefficiat- Ki As mentioned above, Gu Shan Chuan basin has already devided into 4 grades of erosion regions and the place and involved units of each grade of region are determined. For every rain, the Pm, la' 1m and SR (rain cover area) ·of each grade of region can also be obtained. With (3) the modulus of each grade of region-Smi can be got and Smi" SRi = Si. Then for 54 rains during 1977-1983, we have got 54 groups of Sj (i: grade number, i = 1, 2, 3, 4) and S' (the real measured quantity BSL), then, making Si correlated with Sf, the correlated coefficiat (r~) is obtained: r 1 =0.7961, r 2=0.7682, r 3 =0.7565, r 4 =0.5612. With r i, the weighted coefficiat (K i): is acquired REFERECE (4) thus, the revisionary model of each erosion grade is as follows: S I _ mi - K ie P 0.9878 "'-2.0162 • m • By collecting and preprocessing the rain records of the whole basin, with BSL model, the quantity of soil loss of each graded erosion region or the BSL can be estimated. /0.2662 . 0.3726 a .. / m 4.3.3 The modelofBSL The quantity of BSL is: 156 (D Liou Dongshun, Loess Plateau and Environment P401 China Science Press 1985 (2) Cheng Y ongzhong, Recent erosion and control in Loess Plateau P95-122, China Science Press 1988 table 1 NO. (Rain) 1 2 3 4 5 6 7 8 9 10 11 12 13 14 15 16 17 18 19 20 21 22 23 24 25 26 27 28 29 30 31 32 33 34 35 36 37 38 39 40 41 42 43 44 45 46 47 48 49 50 51 52 53 54 QI- Real measured Q2-Calculated QI-Q2 BSL (10~) BSL (10~) (10~) 324.950 251.424 224.621 59.784 30.560 203.558 13.742 12.105 8.441 432.000 205.632 81.907 63.513 35.856 37.117 104.653 12.010 326.880 199.238 130.464 177.206 48.125 23.149 22.982 7.318 73.374 48.652 33.782 32.054 26.577 197.193 39.398 35.873 33.214 22.205 17.764 360426 40.262 10403 312.077 74.740 31.983 24.581 26.559 12.269 214.099 108.000 58.761 68.861 62.294 34.517 32.357 10.558 3.240 233.806 151.597 188.954 43.029 63.218 45.029 14.160 30.792 5.251 340.691 302.068 68.458 66.625 40.696 61.930 113.422 9.843 99.531 62.978 84.960 155.870 46.832 72.844 46.673 8.962 59.387 61.021 30.589 54.491 42.072 241.654 45.109 129.292 44.600 12.168 31.285 44.117 53.168 3.657 354.362 68.660 61.234 34.106 11.543 16.364 263.895 66.769 27.001 75.771 63.883 25.444 77.446 6.342 5.167 157 QI- Q 2 o ---Yo QJ 91.144 99.827 35.667 16.183 -32.653 158.530 -0.436 -18.688 3.190 91.309 -96.436 13.450 -3.111 -4.840 -24.812 -8.769 2.166 263.343 136.260 45.504 21.337 1.292 -49.695 -23.691 -1.645 13.983 -12.370 3.193 -22.437 -15.496 -44.461 -5.711 -93.419 -11.386 10.037 -13.521 -7.791 -12.806 -2.254 -42.285 6.08 -29.251 -9.525 15.016 -4.095 -49.795 41.231 31.760 -6.910 -1.589 9.073 -45.089 4.216 -1.729 -28.0 39.7 -15.9 27.1 106.8 77.8 -3.2 -154.4 37.8 21.1 -46.9 16.4 4.9 -13.5 66.9 -8.4 18.0 72.6 68.4 34.9 12.0 2.7 214.7 -103.1 -22.5 19.1 -25.4 9.5 -70.0 -58.3 -22.6 -14.5 -260.4 -34.3 45.2 -76.1 -21.1 -32.1 -160.7 -13.5 8.1 -91.4 -38.7 -56.5 -33.3 -23.2 38.1 54.0 -10.0 -2.5 26.2 -139.3 39.9 -59.4


