F.
advertisement
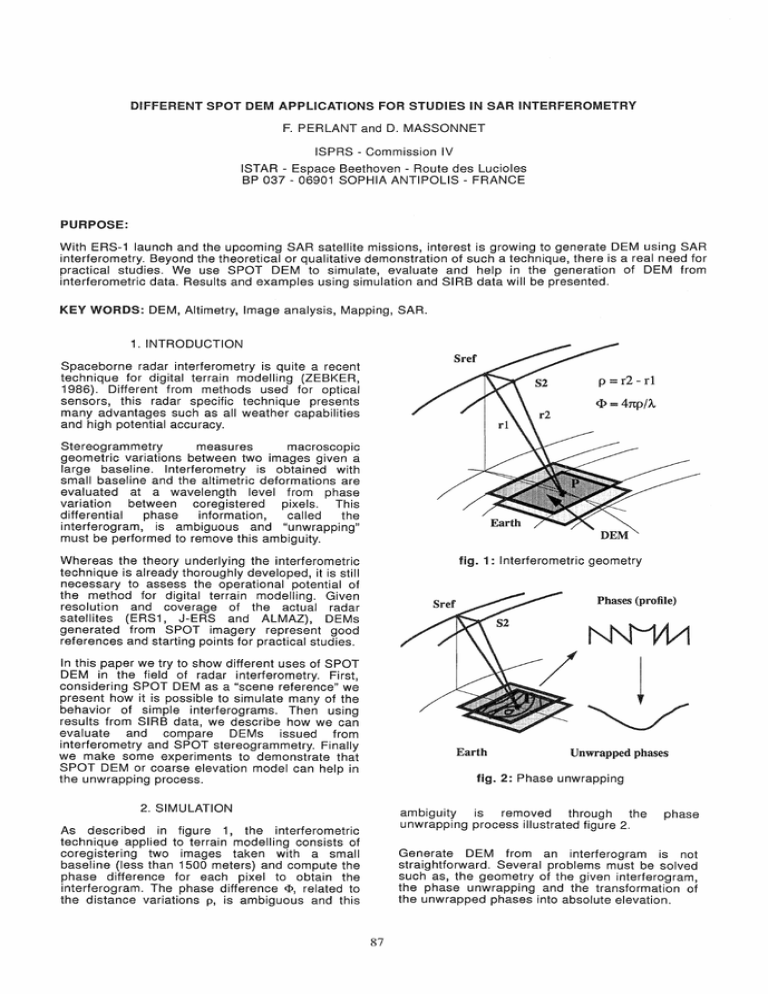
DIFFERENT SPOT DEM APPLICATIONS FOR STUDIES IN SAR INTERFEROMETRY F. PERLANT and D. MASSONNET ISPRS - Commission IV ISTAR - Espace Beethoven - Route des Lucioles BP 037 - 06901 SOPHIA ANTIPOLIS - FRANCE PURPOSE: With ERS-1 launch and the upcoming SAR satellite missions, interest is growing to generate DEM using SAR interferometry. Beyond the theoretical or qualitative demonstration of such a technique, there is a real need for practical studies. We use SPOT DEM to simulate, evaluate and help in the generation of DEM from interferometric data. Results and examples using simulation and SIRB data will be presented. KEY WORDS: DEM, Altimetry, Image analysis, Mapping, SAR. 1. INTRODUCTION Sref Spaceborne radar interferometry is quite a recent technique for digital terrain modelling (ZEBKER, 1986). Different from methods used for optical sensors, this radar specific technique presents many advantages such as all weather capabilities and high potential accuracy. p=r2-rl <P == 4np/A Stereogrammetry measures macroscopic geometric variations between two images given a large baseline. interferometry is obtained with small baseline and the altimetric deformations are evaluated at a wavelength level from phase variation between coregistered pixels. This differential phase information, called the interferogram, is ambiguous and "unwrapping" must be performed to remove this ambiguity. DEM fig. 1: Interferometric geometry Whereas the theory underlying the interferometric technique is already thoroughly developed, it is still necessary to assess the operational potential of the method for digital terrain modelling. Given resolution and coverage of the actual radar satellites (ERS1, J-ERS and ALMAZ), DEMs generated from SPOT imagery represent good references and starting points for practical studies. Phases (profile) In this paper we try to show different uses of SPOT DEM in the field of radar interferometry. First, considering SPOT DEM as a "scene reference" we present how it is possible to simulate many of the behavior of simple interferograms. Then using results from SIRB data, we describe how we can evaluate and compare DEMs issued from interferometry and SPOT stereogrammetry. Finally we make some experiments to demonstrate that SPOT DEM or coarse elevation model can help in the unwrapping process. Earth Unwrapped phases fig. 2: Phase unwrapping 2. SIMULATION ambiguity is removed through the unwrapping process illustrated figure 2. As described in figure 1, the interferometric technique applied to terrain modelling consists of coregistering two images taken with a small baseline (less than 1500 meters) and compute the phase difference for each pixel to obtain the interferogram. The phase difference <P, related to the distance variations p, is ambiguous and this phase Generate DEM from an interferogram is not straightforward. Several problems must be solved such as, the geometry of the given interferogram, the phase unwrapping and the transformation of the unwrapped phases into absolute elevation. 87 Classical SAR simulators can be used to simulate this process. Given two slightly different satellite trajectories, we simulate two SAR images that we coregister to compute the phase differences. In fact, this simulation approach simply imitates the experimental interferogram generation process without presenting the interest of real data. The techniques to set up for such a simulation are complicated and may not be applicable on real interferograms. Instead, we chose to use a simulation technique that simplifies the interferometric process, makes it easy to set up and interpret and allows further experiments. fig. 4: Simulated interferogram in Slant Range geometry for a given satellite trajectory can easily assess the potential elevation accuracy obtainable after unwrapping. In the SPOT OEM the elevation range is about 2048 meters in this area. It comes from figure 5 where we hardly have 1 interfringe region for the whole scene, that the potential restituted elevation accuracy with such a geometry (100 meters baseline) is 8 meters. For the 1000 meters baseline geometry (figure 7), we can count 6 different fringe orders which leads to a potential accuracy of 1.6 meters. fig. 3: portion of a SPOT OEM From a given SPOT OEM (figure 3), considered as the reference terrain, and from two satellites trajectories, we compute directly the phase difference for each point of the terrain. Here, the interferogram generated keeps the SPOT OEM geometry making it easy to evaluate. However it is easy, as shown figure 4, to resample this interferogram into the slant range geometry of the reference satellite if we want to get close to what we would obtain in reality. With classical simulation the simulated interferogram would be in radar (slant range) geometry precluding direct comparison with geocoded SPOT OEM. This approach, whereas being easy to implement, allows us to simply visualize interferograms without dealing with the registration and geometrical problems. The interferograms generated differ from "real interferograms" since they do not take into account the noise effects as well as the uncorrelated pixels. They can still illustrate some of the behavior of the interferometric process. fig. 5: Simulated interferogram with a 100 meters baseline (same effect as for a large wavelength) 2.1 Parameters influence The first use of this simulation has been to assess and demonstrate the potential interferometric accuracy and the influence of the different parameters. Figures 5, 6 and 7 describe different influence of the parameters: fig. 6: Simulated interferogram with a 500 meters baseline (same effect as for a medium wavelength) • Simulations with different wavelength (simulating different radar sensors) show that the smaller the wavelength the smaller the fringe patterns and thus the more accurate the terrain restitution for a given satellites geometry. .. For a given radar wavelength (in this case SEASAT parameter) simulations with different baselines (100, 500 and 1000 meters), show that the larger the baseline, the smaller the fringe patterns and the better the elevation accuracy. Since the interferograms are generated with 256 quantification levels for each interfringe region (corresponding to 21t radians phase rotation), we fig. 7: Simulated interferogram with a 1000 meters baseline (same effect as for a small wavelength) 88 2.2 Interferometric geometry Phase unwrapping, as described by figure 2 is obtained by integrating the phase differences along an arbitrary path so that final phase difference between two adjacent samples is smaller than 1t and greater than -1t radians. To demonstrate that interferometry is not simply terrain slicing, we generated an interferogram for a constant elevation terrain with a large baseline to exaggerate the phenomenon. The interferogram figure 8 presents parallel fringe lines in the azimuth direction (in this case being equal to the North direction). The theory shows that from the distance between two such fringes we can compute the interferometric baseline. Presence of noise and "phase aliasing" corresponding to strong reliefs, translate into integration errors that can propagate. Several approaches using fringe lines (LIN, 1991) and "Ghost lines" (PRATI, 1990) try to overcome these difficulties. Using the simulated interferograms generated, we defined another approach based on interfringe regions. We first segment the interferogram into interfringe regions. To unwrap then we set up for each region an order according to its neighbor regions. This order corresponds to the 21t radians multiple by which we have to rotate the initial phases within each region. This global approach is easy to implement as an interactive process. Figures 11, 12 and 13 show different steps of this process for simulated interferogram shown on figure 7. fig. 8: Interferogram for constant elevation terrain (with exaggeration) 2.3 Orbitoaraphic sensitivity Finally we evaluate the sensitivity of the interferogram according to the variation of the orbitography. Figure 9 and 10 show two interferograms produced with ERS-1 parameters with the orbitographic baseline different for 0.01 meters. We can already notice the small changes in the interferogram, but the interferometric accuracy did not change. This reinforce the idea that the interferometric process is highly sensitive to the interferometric baseline but is stable as a relative information. fig. 11: Interfringe region segmentation Calibration of the interferometric process with control points (coast lines) to be able to generate accurate absolute DEM is therefore necessary. fig. 12: Orders for the interfringe regions fig. 9: Ers1 parameters interferogram fig. 13: Unwrapped phases using the interfringe region orders 2.5 Altimetry restitution fig. 10: Interferogram with satellite distance increased by 1 cm Since, from these simulations, we obtain geocoded unwrapped phases it is easy to compare them with the init!al elevation values of the SPOT DEM. They look alIke but theory and simulations with different constant elevation interferograms show that a complete geometrical model taking into account the orbitographic parameters, is necessary to transform the unwrapped phases into DEM. 2.4 Phase unwrapping Starting from these first experiments we addressed different problems such as phase unwrapping and elevation restitution. 89 With simulations, the interferometric geometry being known, we can generate interferograms for different constant elevations. Figure 14 shows a profile of the interferometric geometry. The fringe lines are the intersections of the terrain with surfaces of constant distance differences that are multiple of the wavelength (hyperbolic profiles) for the satellites positions. Getting a control point or some information about the height of one point in the interferogram is equivalent to defining which fringe line will be the reference one. After unwrapping it is obvious to get directly the absolute height of each point since we just have to intersect the initial interferogram with the set of constant height interferograms. For a given point only one constant height interferogram presents the same phase value than the initial interferogram. This gives the height for this point. complex slant range imagery from which deformations images were deduced, interferogram has been produced at C.N.E.S. (MASSONNET, 1991). Figures 16 and 17 represent the module of the interferometric image in the reference geometry and the generated interferogram. Fringe lines Sref fig. 16: Module image for reference SIR-B scene This particular interferometric data set was obtained with crossed orbits (GABRIEL, 1988) and preprocessing of the interferogram was performed at C.N.E.S. to reduce unwrapping ambiguities. The specificity of these data along with inaccurate informations about the shuttle orbits, encouraged us to simply address the unwrapping problem without trying to restitute the absolute altimetry of the scene. This could be done by adding to the unwrapped phases the phases laws removed by the preprocessing (MASSONNET, 1991) and by obtaining the absolute height from the orbit characteristics of the shuttle. Nevertheless without these informations we can still try to evaluate qualitatively the unwrapped phases: the transformation of these phases to be left to obtain OEM being locally linear transformations. Z = Cste Hyperbole 14: Interferometric altimetry restitution This method is computationally intensive but is very easy to set up to get coarse absolute height information for these simulated interferograms. With real interferograms we need to have a precise orbitography for both satellite positions. Figure 15 presents a coarse partial result for which we have computed constant elevation interferograms every 100 meters. To get a dense OEM we affected several phase values for each level in order to get almost a full partition of the elevation range. With the region method described previously we partially unwrap the initial interferogram to get the result presented figure 18. fig. 15: Coarse altimetry restitution with 100 meters slicing Compared with the initial SPOT OEM this coarse altimetry restitution is within 50 meters accuracy. fig. 17: Phase interferogram image Although this unwrapped result does not correspond to a digital elevation model it contains all the potential relative accuracy of this interferometric data set. We can then compare its relative altimetry values with a reference OEM and in particular a SPOT OEM (figure 19). Since the interferometric product is still in radar slant range geometry, we have to set up the same geometry for 3. EVALUATION To evaluate and compare OEM generated by interferometry we use SPOT stereogrammetry. Under a contract with C.N.E.S. we worked on a couple of SIR-B images taken over northern Canada. After phase-free preprocessing to obtain 90 crossed orbit the relative altimetry of the unwrapped phases at the bottom of the scene is very poor. Figure 21 shows a small portion of the area for which the interferometric process works normally (reasonable baseline). Visually, on this small area, interferometric altimetry information gives nice details that are smoothed on SPOT OEM. Although SPOT OEM generation is not a stable process and can stili be improved, the interferometric result compares quite favorably with it. It is reassuring to notice that interferometry gives altimetric information under the clouds! Further quantitative evaluation such as local noise and mean quadratic error over the scene can be achieved once we compute the absolute altimetry informations from the interferometric process. fig. 18: Partially unwrapped phase interferogram image both informations. Actually we decided to resample the SPOT OEM into the slant range geometry. Using the coarse orbitographic informations for the reference scene, we resampled the 40 by 40 meters SPOT OEM grid into the equivalent of a 50 by 50 meters grid in slant range geometry as shown figure 20. fig. 21: SPOT OEM on top (14 meters (XS) mean quadratic error), and unwrapped phases at the bottom for a small area 19: SPOT OEM with interferometric data coverage framed. 4. INTERACTION After simulation and evaluation let us present some experiments to demonstrate that SPOT OEM or coarse elevation model can help in the unwrapping is simple process. The method followed interferogram subtraction. The resulting interferogram should be easier to unwrap and is related to the altimetry differences between the two initial products. 4.1 Approximated OEMs A first experiment shows how approximated DEMs can be used in this unwrapping process. Coarse altimetric informations are generated by simply smoothing the initial SPOT DEM. Then interferograms are simulated with the same geometry and parameters (ERS-1 parameters) for each OEM. Figure 22 shows the simulated interferogram with a 100 meters interferometric baseline for the initial SPOT OEM. With a very low fig. 20: SPOT OEM resampled into the radar geometry The resampled SPOT OEM can then be compared with the unwrapped interferogram. Because of the 91 pass filtered OEM presenting altimetric errors of up to 30 percents we obtain figure 23. Low pass filtered OEM with altimetric errors of less than 5 percents produce figure 24 interferogram. Fringe patterns are quite different fig. 26: Interferogram differences with a slightly smoothed OEM (one order) fig. 22: Simulated interferogram with 100 m distance between satellites. fig. 27: Initial interferogram after substraction of the simulated phases from coarse OEM From the coarse interferometric OEM restituted in simulation with a 50 meters accuracy (figure 15) we thus unwrapped the initial interferogram as we can see figure 27. fig. 23: Interferogram with a strongly smoothed OEM We then realized the same experiments using slightly different orbitographic parameters for the initial and the "approximated" interferograms. The results are similar proving that the orbitographic accuracy used to generate the different interferograms is not a critical parameter. 4.2 Different orbitoqraphy In these experiments we changed the baseline. We subtract a simple interferogram, generated with a small baseline (figure 6), to a more complicated larger baseline interferogram (figure 9). fig. 24: Interferogram with a slightly smoothed OEM If we subtract these "approximated" interferograms from the initial one that represents the precise altimetric information, we obtain figures 25 and 26. By removing the effect of the coarse relief represented by the very low pass filtered OEM we simplify already the initial interferogram by reducing the fringe orders from 9 to 5. With the slightly smoothed OEM we suppress almost completely the ambiguity problem since the unwrapping process is restricted to subtracting 256 to the bright pixels (above 128) to get a continuous unwrapped phase difference with absolute values below 1t radians. This unwrapped interferogram turned into altimetric information will correspond to the errors between the initial SPOT OEM and the smoothed one. As shown figure 28 this removes a few fringes making the large baseline accurate interferogram simpler to unwrap. So, having an interferometric couple with small baseline that generates easy to unwrap but less accurate interferogram, we can make the interferogram for a large baseline interferometric couple, easier to unwrap. fig. 28: Large baseline interferogram after subtraction of the small baseline interferogram From the small baseline interferogram we can also generate the corresponding OEM and come back to the "approximate" OEM experiment and obtain similar result as figure 27: we suppress directly the unwrapping process. fig. 25: Interferogram differences for the strongly smoothed OEM (5 orders left) 92 These experiments show that without knowing the precise absolute satellite orbitography, we can automatically unwrap the experimental interferogram from relative baseline information. DEM such as partial SPOT DEM or sparse altimetry informations can be transformed into interferograms that can be used to unwrap the initial interferogram or small baseline data set can help and partially unwrap interferograms for large baseline data set. Zebker H.A. & Goldstein R.M., Topographic mapping from interferometric SAR observations, Journal of Geophysical Research vol. 91 nO B5 October 1986. 5. CONCLUSION To assess the operational potential of the SAR interferometry method for digital terrain modelling we presented different experiments using DEM generated from SPOT imagery. SPOT DEM represents good references and can be used in different ways. First, considering SPOT DEM as a "scene reference" we showed how it is possible to simulate some of the behaviors of simple interferograms. Then using results from SIRB data, we described how we can evaluate and compare altimetry information issued from Interferometry and SPOT DEM. Finally we presented some experiments showing that SPOT DEM or coarse altimetry information as well as multi-baseline data can help to unwrap accurate but ambiguous interferograms. With the coming data from satellites such as ERS1, J-ERS or ALMAZ, interest in SAR interferometry for digital terrain modelling is rapidly growing. We believe that, after the theoretical studies already discussed, experiments like the ones we presented here reinforce the idea that interferometry can be a practical way to get DEM. 6. ACKNOWLEDGMENTS We wish to thank J.P.L. scientists for the set of SIR-B images which enabled us to work on real spaceborne imagery. 7. BIBLIOGRAPHY Gabriel A.K. and Goldstein R. M., Crossed orbit interferometry: Theory and experimental results from sir-b, Int. J. Remote Sensing vol. 7 pp 313320 - December 1988. Lin Qian, Vesecky John F. and Zebker Howard A., Topography estimation with interferometric synthetic aperture radar using fringe detection, IEEE Trans. Geoscience Remote Sensing - 1991. Massonnet D. & Rabaute Th., Radar Potentials, interferometry: Limits and presentation at PIERS, Boston 1991- Submitted to IEEE. Prati C., Rocca F., Guarnieri A. M., and Damonti E., Seismic migration for sar focusing: Interferometrical applications, IEEE Trans. Geoscience Remote Sensing vol. 28 pp 627-640 July 1990. 93
