BERG,^ ' Factors influencing red expression in autumn foliage of sugar maple trees
advertisement
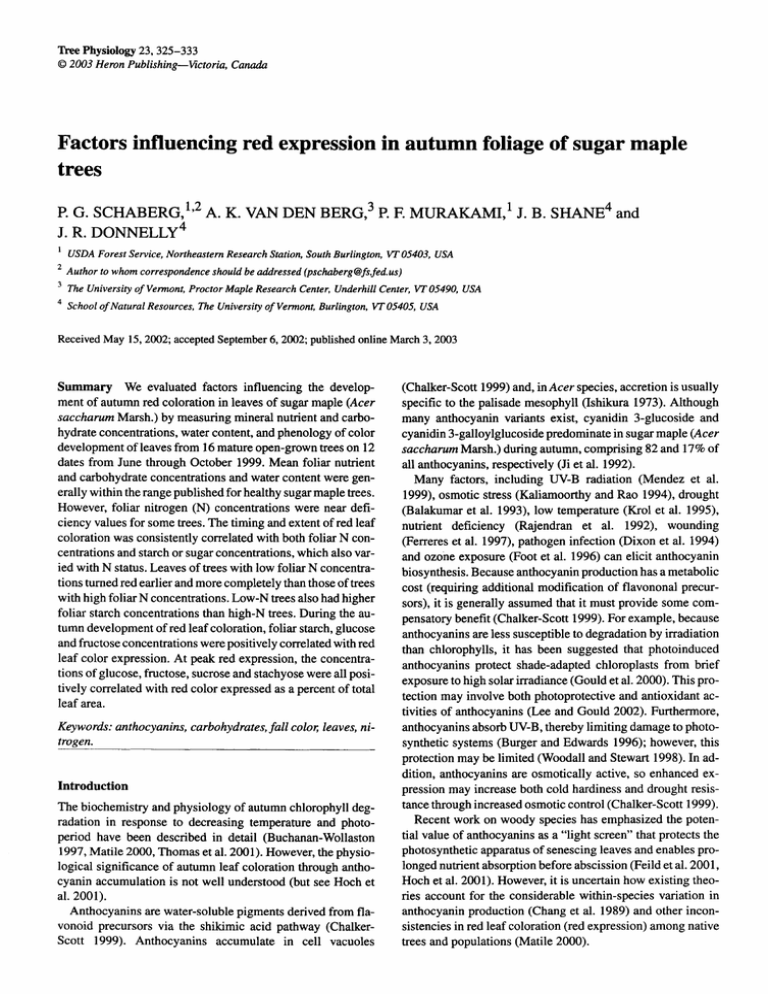
Tree Physiology 23,325-333 O 2003 Heron Publishing-Victoria, Canada Factors influencing red expression in autumn foliage of sugar maple trees P. G. SCHABERG,',~ A. K. VAN DEN J. R. DONNELLY~ BERG,^ P. F. MURAKAMI,' J. B. SHANE~and ' USDA Forest Service, Northeastern Research Station, South Burlington, VT 05403,USA Author to whom correspondence should be addressed (pschaberg@fs.fed.us) The University of Vermont,Proctor Maple Research Center, Underhill Center, VT05490,USA School of Natural Resources, The Universiv of Vermont, Burlington, VT 05405,USA Received May 15,2002;accepted September 6,2002; published online March 3,2003 Summary We evaluated factors influencing the development of autumn red coloration in leaves of sugar maple (Acer saccharum Marsh.) by measuring mineral nutrient and carbohydrate concentrations, water content, and phenology of color development of leaves from 16 mature open-grown trees on 12 dates from June through October 1999. Mean foliar nutrient and carbohydrate concentrations and water content were generally within the range published for healthy sugar maple trees. However, foliar nitrogen (N) concentrations were near deficiency values for some trees. The timing and extent of red leaf coloration was consistently correlated with both foliar N concentrations and starch or sugar concentrations, which also varied with N status. Leaves of trees with low foliar N concentrations turned red earlier and more completely than those of trees with high foliar N concentrations. Low-N trees also had higher foliar starch concentrations than high-N trees. During the autumn development of red leaf coloration, foliar starch, glucose and fructose concentrations were positively correlated with red leaf color expression. At peak red expression, the concentrations of glucose, fructose, sucrose and stachyose were all positively correlated with red color expressed as a percent of total leaf area. Keywords: anthocyanins, carbohydrates, fall color; leaves, nitrogen. Introduction The biochemistry and physiology of autumn chlorophyll degradation in response to decreasing temperature and photoperiod have been described in detail (Buchanan-Wollaston 1997, Matile 2000, Thomas et al. 2001). However, the physiological significance of autumn leaf coloration through anthocyanin accumulation is not well understood (but see Hoch et al. 2001). Anthocyanins are water-soluble pigments derived from flavonoid precursors via the shikimic acid pathway (ChalkerScott 1999). Anthocyanins accumulate in cell vacuoles (Chalker-Scott 1999) and, in Acer species, accretion is usually specific to the palisade mesophyll (Ishikura 1973). Although many anthocyanin variants exist, cyanidin 3-glucoside and cyanidin 3-galloylglucosidepredominate in sugar maple (Acer saccharum Marsh.) during autumn, comprising 82 and 17% of all anthocyanins, respectively (Ji et al. 1992). Many factors, including W - B radiation (Mendez et al. 1999), osmotic stress (Kaliamoorthy and Rao 1994), drought (Balakumar et al. 1993), low temperature (Krol et al. 1995), nutrient deficiency (Rajendran et al. 1992), wounding (Ferreres et al. 1997), pathogen infection (Dixon et al. 1994) and ozone exposure (Foot et al. 1996) can elicit anthocyanin biosynthesis. Because anthocyanin production has a metabolic cost (requiring additional modification of flavononal precursors), it is generally assumed that it must provide some compensatory benefit (Chalker-Scott 1999). For example, because anthocyanins are less susceptible to degradation by irradiation than chlorophylls, it has been suggested that photoinduced anthocyanins protect shade-adapted chloroplasts from brief exposure to high solar irradiance (Gould et al. 2000). This protection may involve both photoprotective and antioxidant activities of anthocyanins (Lee and Gould 2002). Furthermore, anthocyanins absorb W - B , thereby limiting damage to photosynthetic systems (Burger and Edwards 1996); however, this protection may be limited (Woodall and Stewart 1998). In addition, anthocyanins are osmotically active, so enhanced expression may increase both cold hardiness and drought resistance through increased osmotic control (Chalker-Scott 1999). Recent work on woody species has emphasized the potential value of anthocyanins as a "light screen" that protects the photosynthetic apparatus of senescing leaves and enables prolonged nutrient absorption before abscission (Feild et al. 2001, Hoch et al. 2001). However, it is uncertain how existing theories account for the considerable within-species variation in anthocyanin production (Chang et al. 1989) and other inconsistencies in red leaf coloration (red expression) among native trees and populations (Matile 2000). 326 SCHABERG, VAN DEN BERG, MURAKAMI, SHANE AND DONNELLY New information about the causes and physiology of red expression may assist development of models for predicting the timing and quality of autumn leaf coloration. In addition, a detailed understanding of the linkage between stress exposure and anthocyanin production could provide insight into plant stress response systems, and help assess the utility of leaf color analysis as an indicator of stress. In particular, quantitative assessment of red coloration of leaves by remote sensing technologies may facilitate detection of forest stress at the landscape level. To assess the environmental and physiological factors that influence the timing and extent of autumn red leaf coloration in Vermont sugar maple, we determined mineral nutrient and carbohydrate concentrations, water content, and phenology of color development in leaves of 16 open-grown trees from June through October. Computer image analysis was used to quantify leaf color. Methods Plant material and climate data Sixteen open-grown sugar maple trees at the USDA Forest Service Northeastern Research Station in South Burlington, Vermont, USA (elevation 92 m) were sampled on 12 dates between June and October 1999. Five sun-exposed branches about 50 cm long were randomly collected from the lower half of the southern aspect of each tree on each date. A subset of five leaves with no obvious damage was randomly selected from each branch for use in subsequent analyses. For each branch, one leaf was retained for water content analysis. The remaining four leaves were used for chemical and color analyses. Five leaf tissue disks (0.5 cm in diameter) were removed from each of the four leaves and preserved in 80% ethanol at -5 OC for subsequent carbohydrate analysis. Remaining leaf material was scanned to produce digital images for color analysis. After scanning, leaves were oven-dried (65 "C for 96 h) and ground to 0.5-mm particles for nutrient analysis. Climatic data (including day length and air temperature) were obtained from the National Weather Service in Burlington, VT, located about 3.2 krn from the study site. Carbohydrate analysis Soluble carbohydrates were measured by methods adapted from Hinesley et al. (1992). After extraction of the tissue with ethanol, chlorophyll was separated from soluble sugars in the the ethanol supernatant with a Waters CI8Sep-Pak Plus Cartridge (Millipore, Milford, MA). A subsample of the filtered supernatant was dried at 37 "C in a limited volume insert, reconstituted in 200 pl of 0.1 mM Ca EDTA and filtered through a 0.45-pm syringe filter. Samples were analyzed for glucose, fructose, sucrose, stachyose, raffinose and xylose with a Waters HPLC with a Sugar-Pak column. The column was maintained at 90 "C and 0.1 rnM Ca EDTA was used as the solvent at a flow rate of 0.6 ml min-'. Sugar concentrationswere quantified with Waters MillenniumTM2000 software and expressed as mg cm-2 leaf area. The pellet from the ethanol extract was gelatinized with 0.2 N KOH, boiled for 30 minutes in a water bath, and neutralized with 1 M acetic acid. The solubilized starch was then hydrolyzed to glucose with amyloglucosidase (#I01 15, Fluka Chemical, Ronkonkoma, NY) in 0.1 M acetate buffer (pH 4.3, incubated at 55 "C for 30 min, and the reaction terminated by boiling for 4 min. The supernatant was centrifuged for 10 min at 1000 g, and starch quantified by assaying for glucose (glucose assay 115-A, Sigma Chemical, St. Louis, MO) as described by Hendrix (1993). Absorbance at 492 nm of samples and glucose standards was determined with an Inter-Med TIM-200 ELISA plate reader. Starch concentration was calculated based on glucose standard curves and expressed as mg cm-2 leaf area. Foliar chemistry and water content Nitrogen (N) concentration of ground foliar samples (about 4 mg each) was determined with a CHN elemental analyzer (CEC Elemental Analyzer Model 440 with PC Compatible/CEC-490 Interface Unit, Leeman Laboratories, Lowell, MA). Remaining foliar tissue was digested with nitric acid and hydrogen peroxide for cation analysis (Jones and Case 1990). Digestions of 0.5 g of tissue were performed in 75-ml reflux tubes in an AD-4020 block digestor (Westco Scientific Instruments, Danbury, CT). Samples were predigested in 5 ml of concentrated nitric acid at room temperature overnight, and then digested for 1 h at 120 "C, followed by two incubations in 5 ml of 30% hydrogen peroxide at 120 OC for 30 min. Digests were diluted to 75 ml with distilled deionized water and analyzed for a broad spectrum of cations by inductively coupled plasma atomic emission spectroscopy (ICPAES, Plasmaspec 2.5, Leeman Labs). Peach leaf standards from the National Institute of Standards and Technology (SRM 1547) were also digested and analyzed for comparison. Water content was determined as the difference between fresh and dry mass of one leaf per branch subsample. Foliar color analysis Leaf color was measured by digital image analysis. On the day of collection, leaves were scanned at 250 dpi on an Epson Perfection 1200U color scanner (Epson America, Torrance, CA) and saved in tag image file format (TIFF). The scanner was calibrated with system software to ensure that the tone and contrast on the screen matched the original image. All image analyses were conducted with the public domain NIH Image program (developed at the U.S. National Institute of Health and available at http://rsb.info.nih.gov/nih-image/). Necrotic (brown) portions of leaves were graphically removed and omitted from color analysis. Each scanned leaf image was manipulated in NIH Image where it was separated into 2-dimensional images (a black and white image and an 8-bit indexed color image) each comprising three slices (image layers). These 2-dimensional images were "stacked" in order to view all three slices. From the black and white stack, the slice with the greatest contrast between leaf and background was selected for rank filtering, inverted, thresholded and made binary. The color image was converted from RGB (red, green, TREE PHYSIOLOGY VOLUME 23,2003 AUTUMN LEAF COLORATION IN SUGAR MAPLE blue) to HSV (hue, saturation, value) and then stacked to make visible all three of its individual slices. A final leaf image was produced by adding the binary image and the hue slice in image math (an NIH Image subroutine).Using this image and the NIH Image look-up table for RGB color, green (RGB = 000,255,118 to 193,255,000), yellow (RGB = 255,090,000 to 199,255,000) and red (RGB = 255,084,000 to 255,000,060) pixels were identified for each leaf and their correspondingareas quantified. Color values were calculated as a percent of total area on a leaf-by-leaf basis. Individual leaf values were then used to calculate branch and tree color means. Through auxiliary analysis we determined that red leaf coloration measured by computer image analysis is highly correlated (r = 0.877, P = 0.001, n = 22) with spectrophotometrically measured anthocyanin concentrations of sugar maple leaves (data not shown). For this assessment, chlorophyll and carotenoid pigments were first extracted in acetone and water, and then anthocyanin concentrations were determined from methanol extracts (Gould et al. 2000). Statistical analyses Dunnett's tests were used to ascertain the first date of significant change in foliar green, yellow and red coloration during the sampling season. Correlation analyses were conducted to examine relationships among environmental, leaf color and leaf constituent values. Seasonal patterns in coloration were assessed on the basis of mean stand leaf color calculated from whole-tree averages. To assess which constituents might be good predictors of the timing of red color development, we tested relationships between the number of days from bud break to initial red color development and concentrations of leaf constituents for each tree on June 30, the only sample date when no red coloration was detected. To evaluate which constituents best predicted the degree of red color expression, we determined correlations between measurements of the peak percent red color and foliar constituent concentrations for trees on each sample date up to and including the day when percent red significantly increased. To provide a finer degree of assessment at peak coloration, correlations between leaf constituents and the percent red of individual branches were calculated for the date with the highest mean red color expression. Seasonal data were transformed when necessary to satisfy the statistical assumption of homogeneity of variance among dates. Transformationsused the slope of the linear relationship of date means and standard deviations as a power function (Montgomery 2001). For all analyses, differences were considered statistically significant if P I0.05. Results and discussion Seasonal changes in leaf color Mean stand leaf color followed expected seasonal patterns of development, progressing from uniformly green to increasing percentages of red and yellow (Figure 1). However, results of Dunnett's tests indicated that the timing of seasonal change was not uniform among colors. The first significant change in color was an increase in the mean percent red on September 28 (photoperiod = 11.9 h; the preceding week's mean minimum temperature was 7.8 "C). A significant reduction in mean percent green and an increase in percent yellow were first detected on October 13 (photoperiod = 11.1 h; the preceding week's mean minimum temperature was 2.8 "C).The apparent decline in red during mid-October (Figure 1) was a result of early abscission of red leaves relative to yellow leaves. The two environmental factors most often associated with autumn color change and leaf senescence are decreasing photoperiod and temperature (Addicott 1982, Kozlowski and Pallardy 1997). We found that day length and mean minimum air temperature were significantly correlated with mean percent color over the sampling period (Table l), and that curvilinear relationships provided a better fit (higher r and lower P) because abrupt deviations from baseline color intensities occurred. The confounding influence of day length on air temperature (linear correlation r = -0.88, P 5 0.01) prevented independent assessment of these factors. Because sampling was limited to one season, a comprehensive assessment of color phenology was not possible. However, the relative timing of observed color changes highlighted differences in the sensitivity of foliar pigments to low temperatures. The appearance of yellow is dependent on the breakdown of carotenoid-masking chlorophylls (Kozlowski and Pallardy 1997, Matile 2000). This linkage accounted for the synchronous change in green and yellow (Figure 1). The occurrence of this change on the sample date immediately following the first frost (October 6) accords with the known sensitivity of chlorophyll to low temperatures (Kozlowski and Pallardy 1997). Freezing damages chloroplast membranes (Senser et al. 1975, Hincha et al. 1993) and releases chlorophyll that must be detoxified to prevent uncontrolled photooxidative damage (Matile 2000, Thomas et al. 2001). The resulting chlorophyll catabolism involves the oxygenolytic opening of the porphyrin macrocycle, leading to loss of green coloration and photodynamic inactivation of the molecule (Matile 2000). In contrast to chlorophyll, carotenoids are resistent to autumn degradation (Matile 2000). Low temperatures also induce anthocyanin biosynthesis (e.g., Krol et al. 1995, Oren-Shamir and Levi-Nissim 1997, Graham 1998). Consistent with this finding, the majority of red color expression detected in our study occurred after the October 6 frost. However, significant increases in red first occurred 2 weeks before October 6, indicating that cues other than frost must have triggered initial anthocyanin increases. Although stand-based means are useful for examining overall trends in color expression, they mask substantial tree-totree variability in the timing (number of days between bud break and the first expression of > 5% red + yellow) and degree (maximum percent red) of color development. For example, timing of initial color development for individual trees ranged from August 2 to October 19. The degree of maximum red color also varied greatly among trees, ranging from 1 to 91%. There was a significant negative correlation between the timing and degree of color development (r = -0.7 1, P = 0.01). In general, the sooner a tree turned color, the more likely it was TREE PHYSIOLOGY ONLINE at http://heronpublishing.com 328 SCHABERG, VAN DEN BERG, MURAKAMI, SHANE AND DONNELLY Figure 1. Stand means (+ 1 SE) for green (a), yellow (b) and red (c) leaf color on all dates sampled from June through October 1999. Asterisks indicate the first sampling date on which there was a significant change in color as determined by a Dunnett's test. In each panel, the occurrence of the first frost is indicated by an arrow. Day length (A) and mean minimum temperature between sample dates ( 0 )are also shown (d). Date concentrations and standard errors of these parameters in August, as well as minimum and maximum mean values over all sample dates, are shown in Table 2. Most constituents either significantly increased or decreased over time (Table 2). Although August means of foliar nutrients were generally within the range published for healthy sugar maple trees, phosphorus concentrationswere high relative to regional means (Burton et al. 1993, Kolb and McCormick 1993, Horsley et al. 2000). Nitrogen was the only nutrient that approached deficiency values. Foliar N concentrations for the 25% of trees with the to express a high proportion of red. The association of reduced leaf longevity with enhanced red coloration is consistent with reports that environmental stress can accelerate senescence (Burke et al. 1992) and stimulate anthocyanin biosynthesis (Chalker-Scott 1999). Leaf constituents preceding red color development To better assess the physiological and nutritional precursors of red coloration, we periodically measured leaf nutrient concentrations, carbohydrateconcentrationsand water content. Mean Table 1. Linear and quadratic relationships between mean stand percent color and day length or mean minimum temperature for sample dates from June through October 1999. Mean color (%) - Green Yellow Red Mean minimum temperature ("C) Day length (h) Linear relationship Quadratic relationship r r P r P r P 0.950 0.920 0.760 0.001 0.001 0.019 0.850 0.720 0.870 0.005 0.008 0.003 0.940 0.820 0.920 0.001 0.006 0.001 - 0.760 0.680 0.700 P Linear relationship Quadratic relationship - - 0.004 0.015 0.01 1 TREE PHYSIOLOGY VOLUME 23,2003 AUTUMN LEAF COLORATION IN SUGAR MAPLE 329 Table 2. August means and standard errors, seasonal minimum and maximum concentrationsof foliar nutrients and carbohydrates,and water content based on 12 sample dates. Correlation coefficients (r) and P values for correlations of Julian date and mean stand foliar constituents are also shown. The r and P values are in bold when P I 0.05. Constituent August Mean Seasonal SE Minimum Maximum r P A1 (g kg-') Ca (g kg-') Fe (g kg-') K (g kg-') Mg (g kg-') p (g kg-') N (g kg-') Water content (g kg-') Starch (mg ~ m - ~ ) Fructose (mg ~ m - ~ ) Glucose (mg ~ m - ~ ) Raffinose (mg ~ m - ~ ) Stachyose (mg ~ m - ~ ) Sucrose (mg ~ m - ~ ) Xylose (mg ~ m - ~ ) highest concentrations averaged 20.1 g kg-' during August, well within the range of 16.0 to 23.2 g kg-' summarized by Kolb and McCormick (1993) for sugar maple trees. In contrast, concentrations for the 25% of trees with the lowest foliar N concentrations averaged only 16.9 g kg-', which was significantly different from the mean N concentration of the high-N trees (P < 0.001). This N concentration is near the low limit reported for native maple trees, and is below the concentration reported for low quality maple stands in Vermont (Wilmot et al. 1995). Importantly, an N concentration of 16.9 g kg-' is similar to concentrations reported for sugar maple seedlings with N-limited growth (Walters and Reich 1997), and is below the mean N concentration in maple saplings for which N concentration and diameter at breast height (1.3 m) were negatively correlated (Ouimet and Fortin 1992). In addition, our trees spanned the range of N concentrations over which a positive linear relationship between foliar N and net photosynthesis has been found in sugar maple trees (P < 0.001, r2 = 0.60; Ellsworth and Liu 1994). Among other possible influences, low N concentrations likely limited the photosynthetic capacity of some study trees. Foliar water contents averaged 51.5% during August and ranged from 49.0 to 58.6% during the sampling period (Table 2). In August, water content values were slightly lower than those published for greenhouse-grown sugar maple seedlings (Agrell et al. 2000), but were comparable to those reported for other native hardwoods during the growing season (Murakami and Wada 1997).Mean starch and sucrose concentrations in August are consistent with growing season concentrations reported for sugar maple (Liu et al. 1997). The total concentration of other sugars was about twice the foliar starch concentration, as found by Burke et al. (1992). Nitrogen concentrations were positively correlated with the timing of red coloration, whereas starch concentrations were negatively correlated (Table 3). In general, trees with lower fo- liar N and higher foliar starch concentrations in late June exhibited red coloration earlier than other trees. We also assessed which constituents best predicted the subsequent degree of red color expression. Of the many constituents evaluated, few showed a consistent association with peak red color (Table 4). Two exceptions to this trend are noteworthy: (1) N concentration was negatively correlated with the percent peak red coloration on seven of the eight dates assessed; and (2) starch concentration was positively correlated with percent peak red coloration on five of the six sample dates immediately preceding red color initiation. Foliar concentrations of glucose, fructose and xylose were correlated with peak red for several dates in August and September (Table 4). The strength of correla- Table 3. Correlation coefficients (r) and P values for mean tree leaf constituentson June 30 versus the number of days between bud break and the onset of fall color. The r and P values are in bold when P 5 0.05. Constituent A1 (g kg- 9 Ca (g kg-') Fe (g kg-') K (g kg-') Mg (g kg-') P (g kg-') N (g kg-') Water content (g kg-') Starch (mg ~ m - ~ ) Fructose (mg ~ m - ~ ) Glucose (mg ~ m - ~ ) Raffinose (mg ~ m - ~ ) Stachyose (mg ~ m - ~ ) Sucrose (mg cmd2) Xylose (mg ~ m - ~ ) TREE PHYSIOLOGY ONLINE at http://heronpublishing.com r P 330 SCHABERG, VAN DEN BERG, MURAKAMI, SHANE AND DONNELLY tions of glucose and fructose with peak red coloration increased just before the first significant development of red coloration. Foliar Mg and P concentrations were positively correlated with red color expression on only one date (August 2). In addition to their close correlation with red color expression, foliar N and starch concentrations were themselves significantly correlated. In accordance with well-established evidence that N deficiency results in enhanced foliar starch accumulation (Marschner 1995), starch was negatively correlated with N concentrationsfrom the start of sampling through early September (Table 5). This association dissipated, and a negative correlation between N and glucose and fructose concentrations emerged as stand-wide red coloration developed. Foliar N was positively correlated with xylose concentration throughout the growing season (Table 5). The tendency for low-N trees to produce little xylose (a structural carbohydrate used in cell wall growth and development; Buchanan et al. 2000) is another indication that N limitations affected leaf biochemistry. Leaf constituents during peak expression of red The highest overall red color expression was observed on October 13, 1999, when N concentration was negatively correlated with percent red, but starch concentration was not significantly associated (Table 6). Instead, concentrations of four sugars (glucose, fructose, sucrose and stachyose) were all positively and highly correlated with percent red. Foliar concentrations of raffinose, Mn and K were negatively correlated with red coloration, but these associations were weak (Table 6). Possible role of anthocyanins Among the parameters assessed, N, starch and sugar concentrations were most consistently associated with the timing and degree of red color development, and show the most promise as predictors of red color expression. Further evaluation of these constituents could help elucidate the role(s) that anthocyanins play in senescing leaves. Recent research has highlighted the potential role of anthocyanins in facilitating protracted nutrient recovery from the leaves of woody plants during leaf senescence. Feild et al. (2001) noted that red-senescing leaves of red-osier dogwood (Comus stolonifera Michx.) absorbed more light in the bluegreen to orange wavelengths and had higher maximum photosystem I1 photon yields following high light stress than did yellow senescing leaves. They proposed that, by acting as an optical screen that reduces the light capture of senescing chloroplasts, anthocyanins provide photoprotection during the dismantling of the photosynthetic apparatus, thereby reducing the photooxidative damage and fostering more complete nutrient recovery from senescing leaves (Feild et al. 2001). Hoch et al. (2001) compared the anthocyanin production capacity of nine woody genera and observed that species at greatest risk of photoinhibition during leaf senescence (e.g., shade-tolerant late successional species and plants native to cold environ- ments) have the highest capacities for anthocyanin production, a pattern consistent with the light screen hypothesis. They proposed that the primary function of autumn anthocyanin production is to protect the photosynthetic apparatus from photooxidative damage, prolong carbon capture, and help supply the energy and osmotic control needed for phloem export of nutrients from senescing leaves (Hoch et al. 2001). Feild et al. (2001) speculated that the importance of anthocyanin photoprotection may be related to both the ecology and N economy of species. We propose that variations in N nutrition may also help account for differences in anthocyanin expression among trees. We found that both the timing (Table 3) and extent (Table 4) of red color development were significantly correlated with foliar N concentration: low-N trees turned red earlier and more completely than high N-trees. Low-N trees also had higher foliar starch concentrations (Table 5). In addition to N, carbohydrate concentrations were related to red coloration. During the transition to red color expression, foliar starch concentrations, and then concentrations of glucose and fructose (metabolic precursors of anthocyanins), were positively correlated with red coloration (Table 4). Furthermore, at peak red color expression (October 13), the concentrationsof glucose, fructose, sucrose and stachyose were all positively correlated with percent red (Table 6). Nitrogen deficiency leads to an accumulation of foliar starch (Marschner 1995). For our trees, low N concentration was significantly associated with high starch concentration during the growing season and high glucose and fructose concentrations as autumn approached (Table 5). This change could reflect a conversion of starch to sugar over time. Increased carbohydrate concentrations during autumn may indirectly enhance red color expression by providing readily available energy and biochemical building blocks for anthocyanin production (Ishikura 1973). Elevated sugar concentrations (Tholakalabavi et al. 1997, Vitrac et al. 2000) and N deficiency (Rajendran et al. 1992,Bongue-Bartelsman and Phillips 1995) have also been implicated as biochemical signals that induce anthocyanin production. Although our data highlight interesting correlations between red coloration and several important leaf constituents, these relationships do not confirm any causative association among parameters. However, combined with experimentalevidence from herbaceous plant studies, our findings are consistent with the hypothesized role of anthocyanins in supporting nutrient recovery during leaf senescence. Within this context, we propose that: (1) variations in foliar N among our study trees contributed to differences in foliar carbohydrate storage; (2) the resulting ranges of foliar N and carbohydrate concentrations created a spectrum of sugar- and N-induced anthocyanin biosynthesis signals that unequally promoted anthocyanin production; and (3) disparities in carbohydrate storage differentially provided the building blocks and energy needed for anthocyanin synthesis. Enhanced protection of leaf photosystems by anthocyanins would be particularly advantageous for low-N trees with diminished photosynthetic capacities. TREE PHYSIOLOGY VOLUME 23,2003 Table 4. Correlation coefficients (r) and P values for the correlation of mean tree foliar constituents on eight sample dates and final peak red color (8).The r and P values are in bold when P 50.05. Constituent June 30 August 2 P r r August 17 P r August 30 P r P September 7 September 14 September 21 r r r P P September 28 P r P (g kg-') Ca (g kg-') Fe (g kg-') K (g kg-') ~g (g kg-') p (g kg-') N (g kg-') Water content (g kg-') Starch (mg Fructose (mg ~ m - ~ ) Glucose (rng ~ m - ~ ) Raffmose (rng ~ m - ~ ) Stachyose (mg ~ m - ~ ) Sucrose (mg ~ m - ~ ) Xylose (mg ~ m - ~ ) Table 5.Correlationcoefficients(r) and P values for the correlation of mean tree foliar N concentration (%) with mean tree foliar starch or sugar concentrationsfor sampling dates before significant red color development. The r and P values are in bold when P I 0.05. Constituent June 30 August 2 August 17 August 30 September 7 September 14 September 2 1 r P 2 m c gw Y Starch (mg ~ m - ~ ) Fructose (mg ~ m - ~ ) Glucose (mg ~ m - ~ ) Rafinose (mg ~ m - ~ ) Stachyose (mg ~ m - ~ ) Sucrose (mg ~ m - ~ ) Xylose (mg ~ m - ~ ) AUTUMN LEAF COLORATION IN SUGAR MAPLE Ellsworth, D.S. and X. Liu. 1994. Photosynthesis and canopy nutrition of four sugar maple forests on acid soils in northern Vermont. Can. J. For. Res. 24:2118-2127. Feild, T.S., D.W. Lee and N.M. Holbrook. 2001. Why leaves turn red in autumn. The role of anthocyanins in senescing leaves of redosier dogwood. Plant Physiol. 127566-574. Ferreres, F., M.I. Gil, M. Castaner and F.A. Tomas-Barberan. 1997. Phenolic metabolites in red pigmented lettuce (Lactuca sativa). Changes with minimal processing and cold storage. J. Agric. Food Chem. 454249-4254. Foot, J.P., S.J.M. Caporn, J.A. Lee and T.W. Ashenden. 1996. The effect of long-term ozone fumigation on the growth, physiology and frost sensitivity of Calluna vulgaris. New Phytol. 133:503-5 11. Graham, T.L. 1998. Flavonoid and flavonol glycoside metabolism in Arabidopsis. Plant Physiol. Biochem. 36: 135-144. Gould, K.S., K.R. Markham, R.H. Smith and J.J. Goris. 2000. Functional role of anthocyanins in the leaves of Quintinia serrata A. Cunn. J. Exp. Bot. 5 1:1107-1 115. Hendrix, D.L. 1993. Rapid extraction and analysis of nonstructural carbohydrates in plant tissue. Crop Sci. 33: 1306-13 11. Hincha, D.K., I. Bakaltcheva, U. Heber and J.M. Schmitt. 1993. Freeze-thaw damage to thylakoid membranes in vitro and in vivo. In Advances in Plant Cold Hardiness. Eds. P.H. Li and L. Christersson. CRC Press, Boca Raton, pp 187-193. Hinesley, L.E., D.M. Pharr, L.K. Snelling and S.R. Funderburk. 1992. Foliar raffinose and sucrose in four conifer species: relationships with seasonal temperature. J. Am. Soc. Hortic. Sci. 117:852-855. Hoch, W.A., E.L. Zeldin and B.H. McCown. 2001. Physiological significance of anthocyanins during autumnal leaf senescence. Tree Physiol. 21:l-8. Horsley, S.B., R.P. Long, S.W. Bailey, R.A. Hallett and T.J. Hall. 2000. Factors associated with the decline disease of sugar maple on the Allegheny Plateau. Can. J. For. Res. 30:1365-1378. Ishikura, N. 1973. The changes in anthocyanin and chlorophyll content during the autumnal reddening of leaves. Kumamoto J. Sci. Biol. 11:43-50. Ji, S.-B., M. Yokoi, N. Saito and L.-S. Mao. 1992. Distribution of anthocyanins in Aceraceae leaves. Biochem. Syst. Ecol. 2O:77 1-78 1. Jones, J.B., Jr. and V.W. Case. 1990. Sampling, handling, and analyzing plant tissue samples. In Soil Testing and Plant Analysis. 3rd Edn. Ed. R.L. Westerman. Soil Sci. Soc. Am., Book Series No. 3., Madison, WI, pp 389-447. Kaliamoorthy, S. and A.S. Rao. 1994. Effect of salinity on anthocyanin accumulation in the root of maize. Indian J. Plant Physiol. 37: 169-170. Killingbeck, K.T. 1996. Nutrients in senesced leaves: keys to the search for potential resorption and resorption proficiency. Ecology 77~1716-1727. Kolb, T.E. and L.H. McCormick. 1993. Etiology of sugar maple decline in four Pennsylvania stands. Can. J. For. Res. 23:2395-2402. Kozlowski,T.T. and S.G. Pallardy. 1997. Physiology of woody plants. 2nd Edn. Academic Press, San Diego, 41 1 p. 333 Krol, M., G.R. Gray, V.M. Hurry, G. Oquist, L. Malek and N.P.A. Huner. 1995. Low-temperature stress and photoperiod affect an increased tolerance to photoinhibition in Pinus banksiana seedlings. Can. J. Bot. 73:1119-1127. Lee, D.W. and K.S. Gould. 2002. Why leaves turn red. Am. Sci. 90: 524-53 1. Liu, X., D.S. Ellsworth and M.T. Tyree. 1997. Leaf nutrition and photosynthetic performance of sugar maple (Acer saccharum) in stands with contrasting health conditions. Tree Physiol. 17: 169-178. Marschner, H. 1995. Mineral nutrition of higher plants. Academic Press, New York, 889 p. Matile, P. 2000. Biochemistry of Indian summer: physiology of autumnal leaf coloration. Exp. Gerentol. 35: 135-1 58. Mendez, M., D. Gwynn Jones and Y. Manetas. 1999. Enhanced UV-B radiation under field conditions increase anthocyanin and reduces the risk of photoinhibition but does not affect growth in the carnivorous plant Pinguicula vulgaris. New Phytol. 144:275-282. Montgomery, D.C. 2001. Design and analysis of experiments. John Wiley and Sons, New York, 684 p. Murakarni, M. and N. Wada. 1997. Difference in leaf quality between canopy trees and seedlings affects migration and survival of spring-feeding moth larvae. Can. J. For. Res. 27: 1351-1 356. Oren-Shamir, M. and A. Levi-Nissim. 1997. Temperature effect on the leaf pigmentation of Cotinus coggygria "Royal Purple." J. Hortic. Sci. 72:425-432. Ouimet, R. and J.-M. Fortin. 1992. Growth and nutrient status of sugar maple: incidence of forest decline and reaction to fertilization. Can. J. For. Res. 22:699-706. Rajendran, L., G.A. Ravishankar, L.V. Venkataraman and K.R. Prathiba. 1992. Anthocyanin production in callus cultures of Daucus carota as influenced by nutrient stress and osmoticum. Biotechnol. Lett. 14:707-7 12. Senser, M., F. Schotz and E. Beck. 1975. Seasonal changes in structure and function of spruce chloroplasts. Planta 126:l-10. Tholakalabavi, A., J.J. Zwiazek and T.A. Thorpe. 1997. Osmoticallystressed poplar cell cultures: anthocyanin accumulation, deaminase activity, and solute composition. J. Plant Physiol. 151: 489-496. Thomas, H., H. Ougham and S. Hijrtensteiner.2001. Recent advances in the cell biology of chlorophyll catabolism. Adv. Bot. Res. 35: 1-52. Vitrac, X., F. Larronde, S. Krisa, A. Decendit, G. Deffieux and J.M. MCrillon. 2000. Sugar sensing and ca2+-calmodulinrequirement in Vitis vinifera cells producing anthocyanins. Phytochemistry 53: 659-665. Walters, M.B. and P.B. Reich. 1997. Growth of Acer saccharum seedlings in deeply shaded understories of northern Wisconsin: effects of nitrogen and water availability. Can. J. For. Res. 27:237-247. Wilmot, T.R., D.S. Ellsworth and M.T. Tyree. 1995. Relationships among crown condition, growth, and stand nutrition in seven Vermont sugarbushes. Can. J. For. Res. 25386-397. Woodall, G.S. and G.R. Stewart. 1998. Do anthocyanins play a role in UV protection of the red juvenile leaves of Syzygium? J. Exp. Bot. 49: 1447-1450. TREE PHYSIOLOGY ONLINE at http://heronpublishing.com


