AY 2010 Alumni Survey Report Appendix, Tables 1 through 6
advertisement

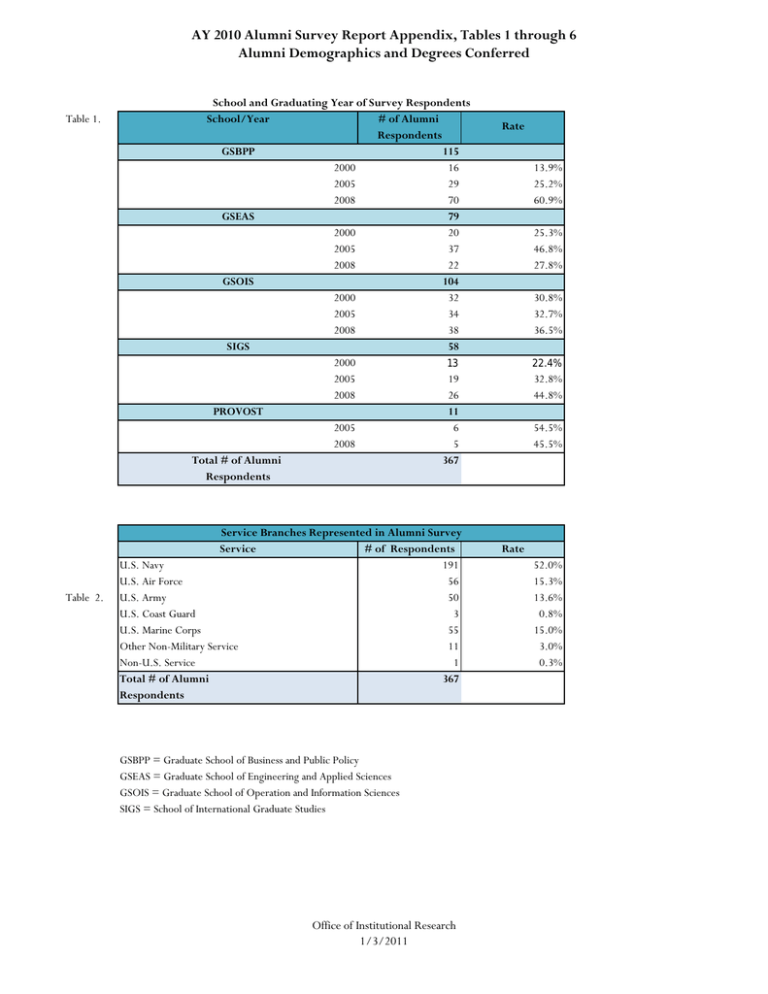
AY 2010 Alumni Survey Report Appendix, Tables 1 through 6 Alumni Demographics and Degrees Conferred Table 1. Table 2. School and Graduating Year of Survey Respondents School/Year # of Alumni Respondents GSBPP 115 2000 16 2005 29 2008 70 GSEAS 79 2000 20 2005 37 2008 22 GSOIS 104 2000 32 2005 34 2008 38 SIGS 58 2000 13 2005 19 2008 26 PROVOST 11 2005 6 2008 5 Total # of Alumni 367 Respondents Service Branches Represented in Alumni Survey Service # of Respondents U.S. Navy 191 U.S. Air Force 56 U.S. Army 50 U.S. Coast Guard 3 U.S. Marine Corps 55 Other Non-Military Service 11 Non-U.S. Service 1 Total # of Alumni 367 Respondents GSBPP = Graduate School of Business and Public Policy GSEAS = Graduate School of Engineering and Applied Sciences GSOIS = Graduate School of Operation and Information Sciences SIGS = School of International Graduate Studies Office of Institutional Research 1/3/2011 Rate 13.9% 25.2% 60.9% 25.3% 46.8% 27.8% 30.8% 32.7% 36.5% 22.4% 32.8% 44.8% 54.5% 45.5% Rate 52.0% 15.3% 13.6% 0.8% 15.0% 3.0% 0.3% AY 2010 Alumni Survey Report Appendix, Tables 1 through 6 Alumni Demographics and Degrees Conferred Table 3. Rank 03 Rank 04 Rank 05 Rank 06 Rank 01 Rank 02 Rank 03 Rank 04 Rank 05 Rank 06 Table 4. Highest or Current Rank of Retired and Active Duty Officers Graduating Year 2000 2005 Retired Officers 15.4% 38.5% 46.2% 0.0% Total # of Retired Officers - 23 Active Duty Officers 0.0% 0.0% 0.0% 14.5% 70.9% 14.5% Total # of Active Duty Officers - 286 Resident vs. Distance Learning Students Type of Program # of Alumni Resident 291 Distance Learning 56 Both 17 Other 3 Total # of Alumni 367 Table 5. M F 2008 0.0% 66.7% 33.3% 0.0% 0.0% 50.0% 25.0% 25.0% 1.0% 0.0% 11.3% 50.5% 35.1% 2.1% 0.0% 1.5% 23.1% 50.7% 22.4% 2.2% Rate 79.3% 15.3% 4.6% 0.8% Rates of Alumni Respondent's Based on Gender and Ethnicity by Year Graduating Year 2000 2005 2008 # Gender of Alumni 91.4% 88.0% 90.1% 329 8.6% 12.0% 9.9% 38 Ethnicity Asian American/Pacific Islander Black/African American Hispanic/Latino White Unknown Total # of Alumni 0.0% 0.0% 0.0% 4.9% 95.1% 81 Office of Institutional Research 1/3/2011 4.8% 5.6% 6.4% 68.8% 14.4% 125 4.3% 4.3% 3.7% 70.8% 16.8% 161 13 14 14 204 122 367 AY 2010 Alumni Survey Report Appendix, Tables 1 through 6 Alumni Demographics and Degrees Conferred Table 6. GSBPP 2000 Master's Acquisitions & Contract Management Defense Systems Analysis Financial Management Leadership Education and Development (DL) Manpower Systems Analysis Systems Acquisition Management Transportation Logistics Management 2005 Executive Master of Business Administration Executive Master of Business Administration (DL) Master's of Business Administration Acquisitions & Contract Management Defense Systems Analysis Financial Management Information Systems Management MBA Manpower Systems Analysis Material Logistics Support Management Systems Acquisition Management Transportation Logistics Management 2008 Executive Master of Business Administration Executive Master of Business Administration (DL) Master's of Business Administration Acquisitions & Contract Management Defense Systems Analysis Financial Management Material Logistics Support Management Supply Chain Management Systems Acquisition Management Master's Contract Management (DL) Leadership Education and Development (DL) Manpower Systems Analysis Program Management (DL) Total # of Students GSEAS 2000 Astronatuical Engineer Degree (AAE) Space Systems Engineering Master's of Engineering Naval/Mechanical Engineering Master's Aeronautical Engineering Combat Systems Sciences & Technology Meteorology and Oceanography (METOC) Naval/Mechanical Engineering NPS/TPS Cooperative Program 16 5 1 3 2 1 2 2 2 2 27 5 3 6 1 4 4 3 1 16 16 33 10 3 9 5 3 3 21 5 1 10 5 115 1 1 1 1 18 3 2 4 4 2 Office of Institutional Research 1/3/2011 AY 2010 Alumni Survey Report Appendix, Tables 1 through 6 Alumni Demographics and Degrees Conferred Space Systems Operations Undersea Warfare 1 2 2005 Bachelor's of Science Meteorology Master's Combat Systems Sciences & Technology Electronic Systems Engineering Meteorology Meteorology and Oceanography (METOC) Naval/Mechanical Engineering Space Systems Engineering Space Systems Operations Systems Engineering (DL) Systems Engineering Management-PD21 (DL) Undersea Warfare 2008 Master's Combat Systems Sciences & Technology Electronic Systems Engineering Naval/Mechanical Engineering Space Systems Operations Systems Engineering Systems Engineering (DL) Systems Engineering Management-PD21 (DL) Undersea Warfare Total # of Students 1 1 36 3 4 3 5 2 3 3 10 1 2 22 1 1 3 4 4 5 2 2 79 GSOIS 2000 Master's Computer Science Information Systems & Technology Information Warfare Intelligence Information Management Joint Cmd, Cntrl, Comm, Comp/Intel (C4I) Sys Operations Analysis Software Engineering (Resident & DL) Special Operations 2005 Master's Computer Science Information Systems & Technology Information Warfare Joint Cmd, Cntrl, Comm, Comp/Intel (C4I) Sys Joint Information Operations Joint Operational Logistics Operations Analysis Software Engineering (Resident & DL) Special Operations 2008 Master Degree 32 6 3 6 2 1 9 3 2 34 2 7 1 3 1 4 8 1 7 8 Office of Institutional Research 1/3/2011 AY 2010 Alumni Survey Report Appendix, Tables 1 through 6 Alumni Demographics and Degrees Conferred Systems Analysis (DL) Master's Computer Science Homeland Security and Defense Human Systems Integration Information Systems & Technology Information Warfare Joint Cmd, Cntrl, Comm, Comp/Intel (C4I) Sys Joint Information Operations Modeling, Virtual Environments & Simulation Operations Analysis Special Operations PhD Software Engineering (Resident & DL) Total # of Students 8 29 2 1 1 3 3 2 3 4 3 7 1 1 104 SIGS 2000 Master's Europe and Eurasia Far East, Southeast Asia, Pacific Middle East, South Asia, Sub-Saharan Africa 2005 Master's Civil-Military Relations Defense Decision-Making and Planning Europe and Eurasia Far East, Southeast Asia, Pacific Homeland Defense and Security Middle East, South Asia, Sub-Saharan Africa 2008 Master's Defense Decision-Making and Planning Europe and Eurasia Far East, Southeast Asia, Pacific Homeland Defense and Security Homeland Security and Defense Middle East, South Asia, Sub-Saharan Africa Western Hemisphere Total # of Students 13 4 5 4 19 2 4 4 2 3 4 26 5 3 6 2 3 5 2 58 Office of Institutional Research 1/3/2011 AY 2010 Alumni Survey Report Appendix, Table 7 Time Spent: Activities and Service/Facility Use Table 7 a. 2000, 2005, 2008 Cohort Activity Class Attendance Homework Research Community Service Outside Employment Family or other personal Table 7b. 2000, 2005, 2008 Cohort Library GSBPP GSEAS GSOIS SIGS Computer Labs GSBPP GSEAS GSOIS SIGS Bookstore GSBPP GSEAS GSOIS SIGS Registration GSBPP GSEAS GSOIS SIGS Academic Counseling GSBPP GSEAS GSOIS SIGS Laboratories GSBPP GSEAS GSOIS SIGS 10 or less 16.3% 11.2% 40.9% 94.0% 87.2% 13.1% Time Spent (%) 11-20 21-30 46.0% 25.6% 46.6% 29.7% 41.1% 14.4% 5.4% 0.5% 1.1% 0.5% 40.1% 31.1% 31-40 41 or more 10.4% 1.6% 9.0% 3.5% 2.2% 1.4% 0.0% 0.0% 4.6% 6.5% 10.4% 5.4% Time Spent (%) Atleast once Atleast once Atleast once Atleast once a Day a Week a Month a Quarter 47.8% 24.3% 6.1% 7.0% 15.2% 43.0% 19.0% 8.9% 34.6% 32.7% 13.5% 8.7% 51.7% 27.6% 17.2% 1.7% Never Other 9.6% 11.4% 7.7% 1.7% 5.2% 2.5% 2.9% 0.0% 40.9% 62.0% 46.2% 37.9% 22.6% 16.5% 30.8% 22.4% 3.5% 2.5% 6.7% 8.6% 3.5% 0.0% 5.8% 3.4% 22.6% 19.0% 9.6% 27.6% 7.0% 0.0% 1.0% 0.0% 1.7% 1.3% 1.0% 0.0% 14.8% 11.4% 15.4% 25.9% 25.2% 24.1% 31.7% 24.1% 33.0% 39.2% 36.5% 39.7% 19.1% 22.8% 14.4% 10.3% 6.1% 1.3% 1.0% 0.0% 0.0% 0.0% 0.0% 1.7% 0.9% 0.0% 1.9% 0.0% 5.2% 10.1% 2.9% 6.9% 60.9% 63.3% 69.2% 75.9% 21.7% 24.1% 20.2% 8.6% 11.3% 2.5% 5.8% 6.9% 0.0% 1.3% 0.0% 0.0% 3.5% 0.0% 4.8% 0.0% 8.7% 19.0% 7.7% 19.0% 28.7% 32.9% 35.6% 39.7% 50.4% 43.0% 47.1% 37.9% 8.7% 3.8% 4.8% 3.4% 0.9% 17.7% 7.7% 1.7% 14.8% 48.1% 28.8% 3.4% 11.3% 8.9% 19.2% 6.9% 10.4% 2.5% 9.6% 1.7% 58.3% 21.5% 28.8% 86.2% 4.3% 1.3% 5.8% 0.0% Office of Institutional Research 1/3/2011 AY 2010 Alumni Survey Report Appendix, Table 8 Thesis Related Topics Table 8. Thesis Question 1. How would you rate the overall relevance of your thesis, dissertation, or terminal project to your career after departing NPS? 2. How would you rate the advising you received for your thesis, dissertation, or terminal-project at NPS? 3. If a recipient of an NPS doctorate, how helpful were your advisors in preparing you for successive academic hurdles on the way to your degree? 4. Did you attend any workshops to help you write your thesis or dissertation? School: GSBPP GSEAS GSOIS SIGS GSBPP = Graduate School of Business and Public Policy GSEAS = Graduate School of Engineering and Applied Sciences GSOIS = Graduate School of Operation and Information Sciences SIGS = School of International Graduate Studies Level Rate Moderate Relevace 40.6% Excellent 55.6% Helpful or More than Helpful 100.0% Y N Y N Y N Y N Y = Yes N = No ▪ Rates for questions #1-3 highlight the highest response rate for that particular question ▪ For thesis question #4, shaded areas represent the higher of the two response rates, for that particular subset Office of Institutional Research 1/3/2011 49.6% 50.4% 34.2% 65.8% 47.1% 52.9% 44.8% 55.2% AY 2010 Alumni Survey Report Appendix, Tables 9 through 10 Alumni Ratings of Faculty, Instruction, Services and Facilities Table 9a-f General Categories (%) Table 9a. School M A L Overall Quality of Instruction GSBPP GSEAS GSOIS SIGS NPS Avg 72.2% 63.3% 72.1% 84.5% 73.0% 27.0% 32.9% 25.0% 13.8% 24.7% 0.9% 3.8% 2.9% 1.7% 2.3% Table 9b. School M A L GSBPP 73.9% 25.2% 0.9% Overall Quality of Faculty GSEAS GSOIS SIGS NPS Avg 64.6% 73.1% 86.2% 74.4% 31.6% 22.1% 13.8% 23.2% 3.8% 4.8% 0.0% 2.4% Table 9c. School M A L GSBPP 58.3% 39.1% 2.6% Amount of Contact with Faculty GSEAS GSOIS SIGS NPS Avg 55.7% 62.5% 81.0% 64.4% 41.8% 35.6% 19.0% 33.9% 2.5% 1.9% 0.0% 1.8% Table 9d. School M A L GSBPP 63.5% 35.7% 0.9% Currency of Course Content GSEAS GSOIS SIGS NPS Avg 46.8% 57.7% 79.3% 61.8% 50.6% 39.4% 19.0% 36.2% 2.5% 2.9% 1.7% 2.0% Table 9e. School M A L Table 9f. School M A L Relevance of Education to National Security and/or Defense GSBPP GSEAS GSOIS SIGS NPS Avg 64.3% 48.1% 62.5% 84.5% 64.9% 34.8% 48.1% 35.6% 12.1% 32.6% 0.9% 3.8% 1.9% 3.4% 2.5% GSBPP 79.1% 20.0% 0.9% Overall Experience GSEAS GSOIS 64.6% 74.0% 31.6% 25.0% 3.8% 1.0% SIGS NPS Avg 82.8% 75.1% 15.5% 23.0% 1.7% 1.8% Office of Institutional Research 1/3/2011 AY 2010 Alumni Survey Report Appendix, Tables 9 through 10 Alumni Ratings of Faculty, Instruction, Services and Facilities Table 10a-g Table 10a. School M A L Facilities/Services (%) Library GSOIS 51.9% 48.1% 0.0% GSBPP 55.7% 40.9% 3.5% GSEAS 31.6% 67.1% 1.3% GSBPP 40.0% 55.7% 4.3% Computer Services GSEAS GSOIS 36.7% 49.0% 59.5% 49.0% 3.8% 1.9% SIGS NPS Avg 44.8% 42.6% 53.4% 54.4% 1.7% 2.9% GSBPP 36.5% 57.4% 6.1% Computer Access GSEAS GSOIS 34.2% 47.1% 60.8% 51.9% 5.1% 1.0% SIGS NPS Avg 37.9% 38.9% 55.2% 56.3% 6.9% 4.8% Table 10d. School M A L GSBPP 14.8% 81.7% 3.5% Bookstore GSEAS GSOIS 11.4% 17.3% 75.9% 73.1% 12.7% 9.6% SIGS NPS Avg 19.0% 15.6% 63.8% 73.6% 17.2% 10.7% Table 10e. School M A L GSBPP 18.3% 78.3% 3.5% Registration GSEAS GSOIS 12.7% 22.1% 86.1% 74.0% 1.3% 3.8% SIGS NPS Avg 24.1% 19.3% 75.9% 78.6% 0.0% 2.1% Table 10f. School M A L GSBPP 16.5% 77.4% 6.1% Academic Counseling GSEAS GSOIS SIGS NPS Avg 17.7% 25.0% 25.9% 21.3% 75.9% 62.5% 72.4% 72.1% 6.3% 12.5% 1.7% 6.7% Table 10g. School M A L GSBPP 13.0% 84.3% 2.6% Laboratories GSEAS GSOIS 27.8% 28.8% 63.3% 67.3% 8.9% 3.8% Table 10b. School M A L Table 10c. School M A L SIGS NPS Avg 75.9% 53.8% 24.1% 45.0% 0.0% 1.2% SIGS NPS Avg 12.1% 20.5% 87.9% 75.7% 0.0% 3.8% GSBPP - Graduate School of Business and Public Policy GSEAS - Graduate School of Engineering and Applied Sciences GSOIS - Graduate School of Operation and Information Sciences SIGS - School of International Graduate Studies NPS - Naval Postgraduate School Avg - Average M - More than adequate A - Adequate L - Less than Adequate Office of Institutional Research 1/3/2011 AY 2010 Alumni Survey Report Appendix, Table 11 NPS Effect on Abilities and Skills Table 11. 2000, 2005, 2008 Cohorts "Importance Of" High importance GSBPP GSEAS GSOIS SIGS PROVOST Moderate importance GSBPP GSEAS GSOIS SIGS PROVOST Low importance GSBPP 334 102 71 98 53 10 32 12 8 6 5 1 1 1 High importance GSBPP GSEAS GSOIS SIGS PROVOST Moderate importance GSBPP GSEAS GSOIS SIGS PROVOST Low importance GSEAS GSOIS 323 97 65 98 53 10 42 18 13 5 5 1 2 1 1 High importance GSBPP GSEAS GSOIS SIGS PROVOST Moderate importance GSBPP GSEAS GSOIS SIGS PROVOST 309 100 60 88 52 9 50 13 17 13 5 2 "Enhancement in" Decision Making 91.0% High Enhancement 147 GSBPP 50 GSEAS 24 GSOIS 47 SIGS 20 PROVOST 6 8.7% Moderate Enhancement 171 GSBPP 53 GSEAS 43 GSOIS 43 SIGS 28 PROVOST 4 0.3% Low Enhancement 49 GSBPP 12 GSEAS 12 GSOIS 14 SIGS 10 PROVOST 1 Analytical Skills 88.0% High Enhancement 269 GSBPP 78 GSEAS 56 GSOIS 82 SIGS 44 PROVOST 9 11.4% Moderate Enhancement 89 GSBPP 34 GSEAS 19 GSOIS 21 SIGS 13 PROVOST 2 0.5% Low Enhancement 9 GSBPP 3 GSEAS 4 GSOIS 1 SIGS 1 Leadership 84.2% High Enhancement 62 GSBPP 23 GSEAS 10 GSOIS 14 SIGS 12 PROVOST 3 13.6% Moderate Enhancement 172 GSBPP 60 GSEAS 38 GSOIS 47 SIGS 21 PROVOST 6 Office of Institutional Research 1/3/2011 40.1% 46.6% 13.4% 73.3% 24.3% 2.5% 16.9% 46.9% AY 2010 Alumni Survey Report Appendix, Table 11 NPS Effect on Abilities and Skills Low importance GSBPP GSEAS GSOIS SIGS 8 2 2 3 1 High importance GSBPP GSEAS GSOIS SIGS PROVOST Moderate importance GSBPP GSEAS GSOIS SIGS PROVOST Low importance GSEAS GSOIS SIGS 300 92 61 88 49 10 64 23 17 15 8 1 3 1 1 1 High importance GSBPP GSEAS GSOIS SIGS PROVOST Moderate importance GSBPP GSEAS GSOIS SIGS PROVOST Low importance GSEAS GSOIS SIGS 214 77 36 59 39 3 147 38 41 43 17 8 6 2 2 2 High importance GSBPP GSEAS GSOIS SIGS PROVOST Moderate importance GSBPP GSEAS 124 39 19 38 26 2 163 55 34 2.2% Low Enhancement GSBPP GSEAS GSOIS SIGS PROVOST Team Work 81.7% High Enhancement GSBPP GSEAS GSOIS SIGS PROVOST 17.4% Moderate Enhancement GSBPP GSEAS GSOIS SIGS PROVOST 0.8% Low Enhancement GSBPP GSEAS GSOIS SIGS PROVOST Writing 58.3% High Enhancement GSBPP GSEAS GSOIS SIGS PROVOST 40.1% Moderate Enhancement GSBPP GSEAS GSOIS SIGS PROVOST 1.6% Low Enhancement GSBPP GSEAS GSOIS Research 33.8% High Enhancement GSBPP GSEAS GSOIS SIGS PROVOST 44.4% Moderate Enhancement GSBPP GSEAS Office of Institutional Research 1/3/2011 133 32 31 43 25 2 36.2% 124 52 30 20 14 8 189 51 40 65 31 2 54 12 9 19 13 1 33.8% 212 67 37 54 51 3 128 38 35 40 7 8 27 10 7 10 235 74 48 61 47 5 118 35 27 51.5% 14.7% 57.8% 34.9% 7.4% 64.0% 32.2% AY 2010 Alumni Survey Report Appendix, Table 11 NPS Effect on Abilities and Skills GSOIS SIGS PROVOST Low importance GSBPP GSEAS GSOIS SIGS PROVOST High importance GSBPP GSEAS GSOIS SIGS PROVOST Moderate importance GSBPP GSEAS GSOIS SIGS PROVOST Low importance GSBPP GSEAS GSOIS SIGS PROVOST 43 24 7 80 21 26 23 8 2 299 95 65 82 51 6 58 17 13 19 6 3 10 3 1 3 1 2 GSOIS SIGS PROVOST 21.8% Low Enhancement GSBPP GSEAS GSOIS 40 11 5 14 6 4 3 PROVOST Ethics 81.5% High Enhancement GSBPP GSEAS GSOIS SIGS PROVOST 15.8% Moderate Enhancement GSBPP GSEAS GSOIS SIGS PROVOST 2.7% Low Enhancement GSBPP GSEAS GSOIS SIGS PROVOST Total # of Alumni = 367 1 Office of Institutional Research 1/3/2011 70 23 11 18 15 3 184 57 43 51 28 5 113 35 25 35 15 3 3.8% 19.1% 50.1% 30.8% AY 2010 Alumni Survey Report Appendix, Table 12 NPS Value to Alumni Table 12a. Table 12b. Rate of Alumni Who Would Recommend NPS to Peers Yes 359 97.8% No 8 2.2% Total # of Alumni = 367 Recommendations on Changes to NPS Grad Year Rate # of Responses 2000 24.1% 41 2005 54 31.8% 2008 75 44.1% Total # of Responses = 170 46.3% Overall Rate of Alumni Responses Office of Institutional Research 1/3/2011


