The United Nations Office for Coordination of Humanitarian Affairs (OCHA)... compiled a series of reports on restrictions to movement of... Appendix I
advertisement

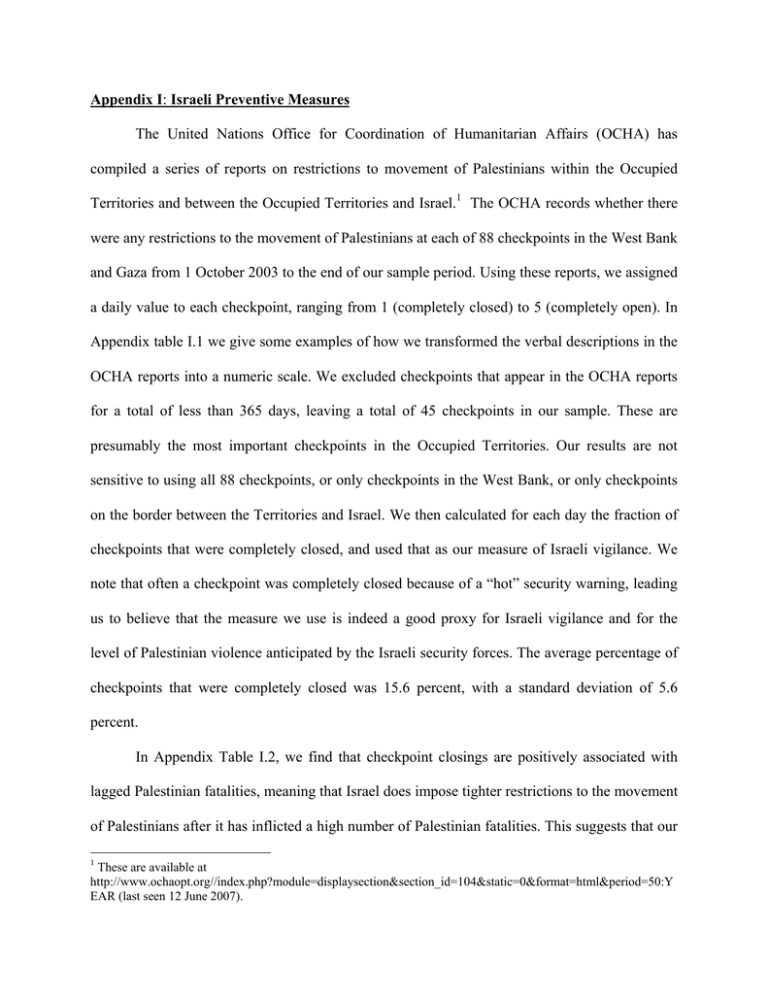
Appendix I: Israeli Preventive Measures The United Nations Office for Coordination of Humanitarian Affairs (OCHA) has compiled a series of reports on restrictions to movement of Palestinians within the Occupied Territories and between the Occupied Territories and Israel.1 The OCHA records whether there were any restrictions to the movement of Palestinians at each of 88 checkpoints in the West Bank and Gaza from 1 October 2003 to the end of our sample period. Using these reports, we assigned a daily value to each checkpoint, ranging from 1 (completely closed) to 5 (completely open). In Appendix table I.1 we give some examples of how we transformed the verbal descriptions in the OCHA reports into a numeric scale. We excluded checkpoints that appear in the OCHA reports for a total of less than 365 days, leaving a total of 45 checkpoints in our sample. These are presumably the most important checkpoints in the Occupied Territories. Our results are not sensitive to using all 88 checkpoints, or only checkpoints in the West Bank, or only checkpoints on the border between the Territories and Israel. We then calculated for each day the fraction of checkpoints that were completely closed, and used that as our measure of Israeli vigilance. We note that often a checkpoint was completely closed because of a “hot” security warning, leading us to believe that the measure we use is indeed a good proxy for Israeli vigilance and for the level of Palestinian violence anticipated by the Israeli security forces. The average percentage of checkpoints that were completely closed was 15.6 percent, with a standard deviation of 5.6 percent. In Appendix Table I.2, we find that checkpoint closings are positively associated with lagged Palestinian fatalities, meaning that Israel does impose tighter restrictions to the movement of Palestinians after it has inflicted a high number of Palestinian fatalities. This suggests that our 1 These are available at http://www.ochaopt.org//index.php?module=displaysection&section_id=104&static=0&format=html&period=50:Y EAR (last seen 12 June 2007). constructed measure of border closings is a reasonable proxy for Israeli vigilance. We also find that lagged Israeli fatalities are strongly positively associated with closings, suggesting that to some extent Israel uses closings as a retaliatory measure against Palestinian violence. Appendix Table I.1: Numeric Codes for Checkpoint Status The verbal reports of OCHA were transformed into a numeric scale as follows: 1- Checkpoint closed 2- Open only for permit holders, Palestinians with Jerusalem ID, international citizens, UN representatives, etc. 3- Open only for residents of some villages, cities or for workers and traders with permits. 4- Open, but there is some restriction on age, hours of opening, or there are searches and long delays. 5- Open without restrictions. The following table gives some examples of how the verbal reports were transformed into a numeric scale for one specific checkpoint on selected dates. Checkpoint Beit Jala DCO Entrance to Beit Jala, Bethlehem District Date 20-26 October 2004 Description Open from 7am to 7pm for all traffic. Palestinian public and private vehicles are allowed to pass. Buses of Hebron national bus company and commercial trucks are not allowed to cross: the buses drop off passengers at the Al Khadr - Husan junction. On 25 and 26 October, it was open for 24 hours due to the closure of Gilo checkpoint. Delays were experienced for vehicles going out of Bethlehem. Code 5 on October 25 and 26 4 on all other days. Beit Jala DCO Entrance to Beit Jala, Bethlehem District 4-10 August 2004 Open 7am to 7pm for all traffic. Palestinian public and private vehicles are allowed to pass. Only buses of Hebron national bus company are not allowed to cross. Long queues and delays were experienced for the vehicles coming out of Bethlehem. 4 on all days. Beit Jala DCO Entrance to Beit Jala, Bethlehem District 28 July 2004 – August 3 2004 Open from 07:00 – 19:00 for all traffic. Palestinian public and private vehicles are allowed to pass. Only buses of Hebron national bus company are not allowed to cross. Long queues and delays were experienced for the vehicles coming out of Bethlehem. On 2 August it was closed due to hot security warnings. 1 on 2 August, 4 on all other days Beit Jala DCO Entrance to Beit Jala, Bethlehem District 9-15 June 2004 On 13 June the checkpoint was opened for all traffic, after being closed since 3 March 2004. Palestinian vehicles need permits to cross. Buses of Hebron national bus company are not allowed to cross. 1 on 9-12 June 3 on 13-15 June Beit Jala DCO Entrance to Beit Jala, Bethlehem District 22 February 2004 – 16 March 2004 Reopened on 25 February following complete closure after 22 Feb. Closing time at 19:00 hindering ability of medical services to carry out emergency assistance in all villages to the west of Bethlehem after this time. Closed since 03 March. 1 on 22-24 February 4 on 25 February - March 2 1 on March 3- March 16 Beit Jala DCO Entrance to Beit Jala, Bethlehem District 3-9 December 2003 Open 7:00 to 19:00 hours to internationals and Palestinians with permits. 2 on all days. Appendix Table I.2 The Relationship between Border Closings and Fatalities Coef. z Number of Palestinian fatalities in days: t -1 to t -7 t -8 to t -14 .00045 .00088 2.93 4.80 Number of Israeli fatalities in days: t -1 to t -7 t -8 to t -14 .00385 .00417 5.69 5.91 χ2 for joint sig. of Palestinian fatalities (p -value 39.07 (<.001) χ2 for joint sig. of Israeli fatalities (p -value) 57.65 (<.001) R2 .251 Note: Dependent variable is fraction of checkpoints closed. Estimated with ordinary least squares and includes day-of-week indicators as well as the length of the separation barrier as regressors. Heteroskedasticity-consistent standard errors. Source: Authors' tabulations of daily data from B'Tselem from 1 October 2003 to 15 January 2005. Appendix II: Intended Palestinian Violence Our focus on realized violence may miss many non-lethal activities by the Palestinians and induce considerable bias into our estimates of the reaction functions. This may remove the appearance of tit-for-tat actions by the Palestinians when they are, in fact, following that strategy. Numerous attempted Palestinian attacks have been thwarted by IDF intelligence operations, which have led to arrests of terror suspects and en route interceptions of suicide bombers. The IDF has collected data on the total number of successful and of unsuccessful attacks from the beginning of the Intifada until the end of 2004.2 We use these data to estimate a series of Palestinian reaction functions. These estimates are presented in columns 1 through 3 of Appendix Table 1, with dependent variables being the total number of Palestinian attacks, the number of prevented attacks, and the number of successful attacks, respectively. Because the data are measured only at a monthly frequency, we have 51 observations, and therefore include as regressors only one lag of Palestinian and Israeli fatalities as well as our period indicators and the completed length of the separation barrier variable. In the first column, we find no correlation between the total level of intended Palestinian violence (both successful and unsuccessful) and the lagged number of Palestinian fatalities. We also find no quantitatively or statistically significant relationship between the number of prevented attacks and past Israeli violence, in column 2. In the third column we simply reproduce the results on realized violence presented previously, this time using the IDF count of successful attacks instead of the B'Tselem data. Whether measured using successful 2 Unsuccessful attacks include those that were either thwarted by a preventive action by the IDF or the General Security Service, or were not carried out because of “work accidents” or other failures in the execution of the attack. These data are publicly available on a monthly frequency from the IDF web site. Unfortunately, higher frequency data on successful and unsuccessful attacks is not made available to the public for security reasons, preventing us from analyzing whether the intended level of Palestinian violence responds to Israeli violence in the short run. (fatal) attacks, unsuccessful attacks, or total attacks, we continue to find no effect of lagged Palestinian fatalities on the level of Palestinian violence. In the last column of the table, we use as the proxy for intended violence the monthly average of terror warnings per day received by Israel's security forces, available for 2004 and 2005. Terror warnings can take many forms, ranging from a detailed notification of a terrorist operation to take place at a specific time and place, to a more general warning about the intentions of militant groups to carry out attacks.3 Again, we find no evidence that the overall number of Palestinian fatalities raises the number of terror warnings. Indeed, the coefficient in column 4 is small in magnitude and negative. We are hesitant to place too much weight on these results, however, because of the small number of observations (24), and because they encompass the period of “declared calm” announced by Hamas after the election of Mahmoud Abbas in January 2005.4 It is nevertheless striking that there is no hint of a positive correlation between lagged Israeli violence and the number of terror warnings. While of course we are cautious about placing too much emphasis on results based on regressions with so few observations, the estimates confirm the results of our previous analysis. The preponderance of evidence suggests that the Palestinians do not respond in a systematic way to Israeli violence, regardless of whether the Palestinians’ response is measured by realized fatalities or by intended violence. 3 Data on the number of terror warnings is available from the Israeli Prime Minister’s web site, under the heading of GSS announcements: http://www.pm.gov.il/PMOEng/Communication/Spokesman/gss/gss060105.htm (for 2004), and http://www.pm.gov.il/PMOEng/Communication/Spokesman/gss/spoketer020106.htm (for 2005). 4 In 2005, the number of fatalities dropped roughly by a factor of 4, for both Israelis and Palestinians. Appendix Table II.1 The Effect of Palestinian Fatalities on Palestinian Intended and Realized Violence (z -ratios in parentheses) Dependent variable: Time period: Number of Palestinian fatalities in month t -1 R2 N (1) (2) Total Palestinian Prevented attacks attacks Oct 2000- Oct 2000Dec 2004 Dec 2004 (3) Successful (fatal) attacks Oct 2000Dec 2004 (4) Terror warnings Jan 2004Dec 2005 .005 (0.31) .002 (0.16) .003 (0.44) -.057 (-2.03) .618 51 .736 51 .471 51 .043 24 Note: All models estimated with ordinary least squares and include lagged Israeli fatalities and period indicators as well as the length of the separation barrier as regressors. Heteroskedasticity-consistent standard errors. Source: Authors' tabulations of monthly data from B'Tselem and the Israeli Defense Force.


