Linear Functions: Worksheet A
advertisement
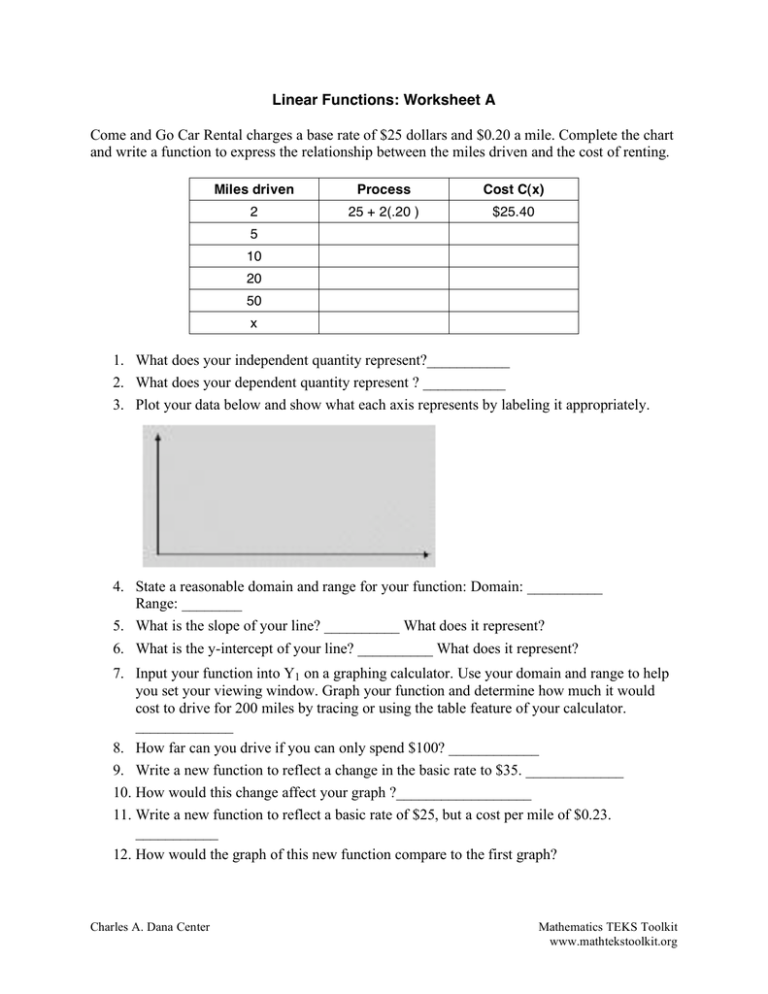
Linear Functions: Worksheet A Come and Go Car Rental charges a base rate of $25 dollars and $0.20 a mile. Complete the chart and write a function to express the relationship between the miles driven and the cost of renting. Miles driven Process Cost C(x) 2 25 + 2(.20 ) $25.40 5 10 20 50 x 1. What does your independent quantity represent?___________ 2. What does your dependent quantity represent ? ___________ 3. Plot your data below and show what each axis represents by labeling it appropriately. 4. State a reasonable domain and range for your function: Domain: __________ Range: ________ 5. What is the slope of your line? __________ What does it represent? 6. What is the y-intercept of your line? __________ What does it represent? 7. Input your function into Y1 on a graphing calculator. Use your domain and range to help you set your viewing window. Graph your function and determine how much it would cost to drive for 200 miles by tracing or using the table feature of your calculator. _____________ 8. How far can you drive if you can only spend $100? ____________ 9. Write a new function to reflect a change in the basic rate to $35. _____________ 10. How would this change affect your graph ?__________________ 11. Write a new function to reflect a basic rate of $25, but a cost per mile of $0.23. ___________ 12. How would the graph of this new function compare to the first graph? Charles A. Dana Center Mathematics TEKS Toolkit www.mathtekstoolkit.org

