Long-term trends in Northern European storminess since 1850?
advertisement
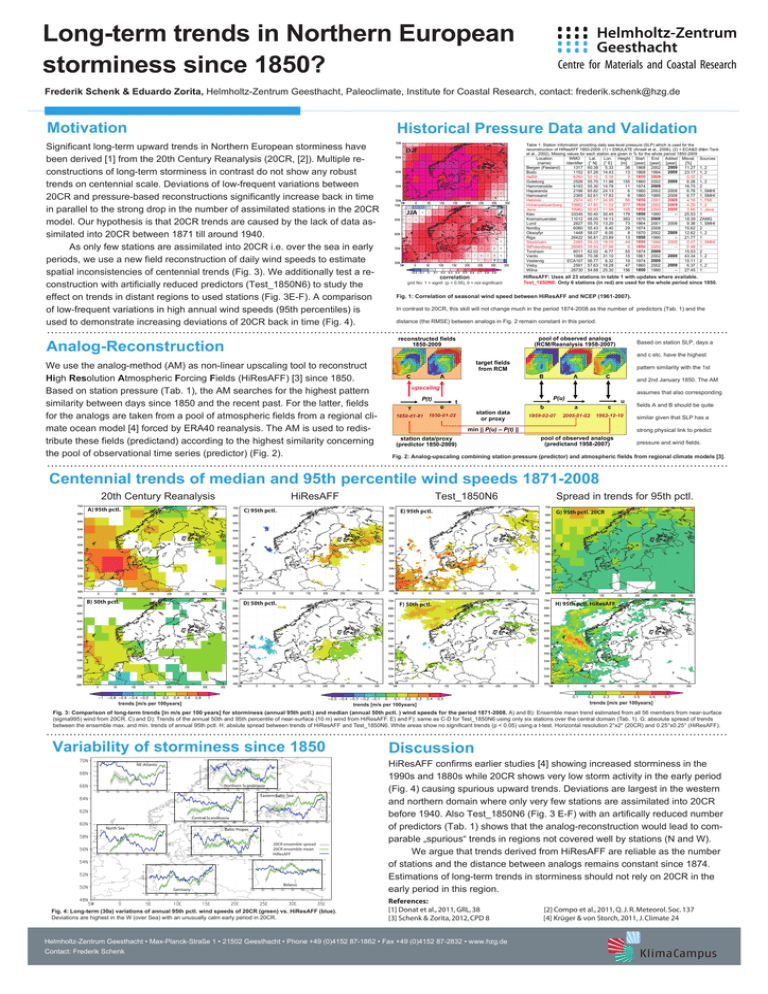
Long-term trends in Northern European storminess since 1850? Frederik Schenk & Eduardo Zorita, Helmholtz-Zentrum Geesthacht, Paleoclimate, Institute for Coastal Research, contact: frederik.schenk@hzg.de Motivation Historical Pressure Data and Validation Significant long-term upward trends in Northern European storminess have been derived [1] from the 20th Century Reanalysis (20CR, [2]). Multiple reconstructions of long-term storminess in contrast do not show any robust trends on centennial scale. Deviations of low-frequent variations between 20CR and pressure-based reconstructions significantly increase back in time in parallel to the strong drop in the number of assimilated stations in the 20CR model. Our hypothesis is that 20CR trends are caused by the lack of data assimilated into 20CR between 1871 till around 1940. As only few stations are assimilated into 20CR i.e. over the sea in early periods, we use a new field reconstruction of daily wind speeds to estimate spatial inconsistencies of centennial trends (Fig. 3). We additionally test a reconstruction with artificially reduced predictors (Test_1850N6) to study the effect on trends in distant regions to used stations (Fig. 3E-F). A comparison of low-frequent variations in high annual wind speeds (95th percentiles) is used to demonstrate increasing deviations of 20CR back in time (Fig. 4). Table 1: Station information providing daily sea-level pressure (SLP) which is used for the reconstruction of HiResAFF 1850-2009. (1) = EMULATE (Ansell et al., 2006), (2) = ECA&D (Klein Tank et al., 2002), Missing values for each station are given in % for the whole period 1850-2009 Location WMO Lat. Lon. Height Start End Added Misval. Sources (name) Identifier [° N] [° E] [m] [year] [year] [year] [%] 2009 Bergen (Flesland) 1317 60.38 5.33 36 1868 2002 11.27 1, 2 2009 Bodo 1152 67.26 14.43 13 1868 1994 23.17 1, 2 deBilt 6260 52.10 5.18 2 1850 2009 0.02 2 2009 Goteborg 2526 55.70 11.98 155 1860 2002 6.28 1, 2 2009 Hammerodde 6193 55.30 14.78 11 1874 16.75 2 Haparanda 2196 65.82 24.13 6 1860 2002 2008 6.78 1, SMHI Harnosand 2365 62.61 17.93 6 1860 1995 2008 6.77 1, SMHI 2009 Helsinki 2974 60.17 24.95 56 1850 2001 4.16 1, FMI 2009 Hohenpeissenberg 10962 47.80 11.02 977 1850 2002 4.28 1, 2 2009 Jena 10962 50.93 11.58 155 1850 2000 3.65 1, Jena Kiev 33345 50.40 30.45 179 1850 1990 -25.53 1 Kremsmuenster 11012 48.05 14.13 383 1876 2009 18.39 ZAMG Lund 2627 55.70 13.20 73 1864 2001 2008 9.38 1, SMHI Nordby 6080 55.43 8.40 29 1874 2008 15.62 2 2009 Oksoyfyr 1448 58.07 8.05 8 1870 2002 12.62 1, 2 Riga 26422 56.81 23.89 13 1850 1990 -21.77 1 Stockholm 2485 59.33 18.05 44 1850 1998 2008 0.47 1, SMHI StPetersburg 26063 59.93 27.96 6 1850 2000 -5.48 1 Torshavn 6011 62.02 -6.77 55 1874 2009 15.53 2 2009 Vardo 1098 70.36 31.10 15 1861 2002 43.34 1, 2 Vestervig ECA107 56.77 8.32 19 1874 2009 15.11 2 2009 Visby 2591 57.63 18.28 47 1860 2002 6.37 1, 2 1850 Wilna 26730 54.68 25.30 156 1990 -27.45 1 DJF JJA correlation grid No: 1 = signif. (p < 0.05), 0 = not significant Fig. 1: Correlation of seasonal wind speed between HiResAFF and NCEP (1961-2007). In contrast to 20CR, this skill will not change much in the period 1874-2008 as the number of predictors (Tab. 1) and the distance (the RMSE) between analogs in Fig. 2 remain constant in this period. pool of observed analogs (RCM/Reanalysis 1958-2007) reconstructed fields 1850-2009 Analog-Reconstruction We use the analog-method (AM) as non-linear upscaling tool to reconstruct High Resolution Atmospheric Forcing Fields (HiResAFF) [3] since 1850. Based on station pressure (Tab. 1), the AM searches for the highest pattern similarity between days since 1850 and the recent past. For the latter, fields for the analogs are taken from a pool of atmospheric fields from a regional climate ocean model [4] forced by ERA40 reanalysis. The AM is used to redistribute these fields (predictand) according to the highest similarity concerning the pool of observational time series (predictor) (Fig. 2). HiResAFF: Uses all 23 stations in table 1 with updates where available. Test_1850N6: Only 6 stations (in red) are used for the whole period since 1850. . target fields from RCM A C Based on station SLP, days a and c etc. have the highest pattern similarity with the 1st B A C and 2nd January 1850. The AM upscaling P(t) P(u) t γ α 1850-01-01 1850-01-02 assumes that also corresponding station data or proxy b a c 1959-02-07 2005-01-02 1963-12-10 min || P(u) – P(t) || station data/proxy (predictor 1850-2009) u fields A and B should be quite similar given that SLP has a strong physical link to predict pool of observed analogs (predictand 1958-2007) pressure and wind fields. Fig. 2: Analog-upscaling combining station pressure (predictor) and atmospheric fields from regional climate models [3]. Centennial trends of median and 95th percentile wind speeds 1871-2008 20th Century Reanalysis HiResAFF Test_1850N6 Spread in trends for 95th pctl. A) 95th pctl. C) 95th pctl. E) 95th pctl. G) 95th pctl. 20CR B) 50th pctl. D) 50th pctl. F) 50th pctl. H) 95th pctl. HiResAFF trends [m/s per 100years] trends [m/s per 100years] trends [m/s per 100years] Fig. 3: Comparison of long-term trends [in m/s per 100 years] for storminess (annual 95th pctl.) and median (annual 50th pctl. ) wind speeds for the period 1871-2008. A) and B): Ensemble mean trend estimated from all 56 members from near-surface (sigma995) wind from 20CR. C) and D): Trends of the annual 50th and 95th percentile of near-surface (10 m) wind from HiResAFF. E) and F): same as C-D for Test_1850N6 using only six stations over the central domain (Tab. 1). G: absolute spread of trends between the ensemble max. and min. trends of annual 95th pctl. H: abslute spread between trends of HiResAFF and Test_1850N6. White areas show no significant trends (p < 0.05) using a t-test. Horizontal resolution 2°x2° (20CR) and 0.25°x0.25° (HiResAFF). Variability of storminess since 1850 NE-Atlantic 7.6 4.2 7.2 wind speed anomalies [m/s] 7.8 7 7.4 6.8 7.2 6.6 7 6.6 3 4 2.8 3.8 Northern Scandinavia 6.4 6.8 1860 1880 1900 1920 1940 1960 1980 Discussion 3.6 6.2 2000 3.8 1860 1880 1900 1920 1940 3.2 1960 4 2.6 2000 1980 3 Eastern Baltic Sea 3.6 3.8 3 2.8 3.4 2.8 3.6 2.6 2000 3.4 3.2 3 6.2 5.2 Central Scandinavia 1860 1900 1920 1940 1960 5.4 North Sea 6 1880 1980 1860 1880 1900 1920 1940 1960 1980 2.6 2000 3.8 Baltic Proper 5.2 5 5.8 5 5.6 3.6 4.8 5.4 5.2 4.8 1860 1880 1900 1920 1940 1960 1980 4.6 2000 4.6 1860 1880 1900 1920 1940 1960 1980 3.4 2000 20CR ensemble spread 20CR ensemble mean HiResAFF 3.6 3.6 2.6 3.2 3.4 3.4 2.4 3.2 3 3.2 Belarus 3 Germany 2.8 1860 1880 1900 1920 1940 3 1960 1980 1860 1880 1900 1920 1940 1960 1980 2.2 2000 2.8 2000 Fig. 4: Long-term (30a) variations of annual 95th pctl. wind speeds of 20CR (green) vs. HiResAFF (blue). Deviations are highest in the W (over Sea) with an unusually calm early period in 20CR. HiResAFF confirms earlier studies [4] showing increased storminess in the 1990s and 1880s while 20CR shows very low storm activity in the early period (Fig. 4) causing spurious upward trends. Deviations are largest in the western and northern domain where only very few stations are assimilated into 20CR before 1940. Also Test_1850N6 (Fig. 3 E-F) with an artifically reduced number of predictors (Tab. 1) shows that the analog-reconstruction would lead to comparable „spurious“ trends in regions not covered well by stations (N and W). We argue that trends derived from HiResAFF are reliable as the number of stations and the distance between analogs remains constant since 1874. Estimations of long-term trends in storminess should not rely on 20CR in the early period in this region. References: [1] Donat et al., 2011, GRL, 38 [3] Schenk & Zorita, 2012, CPD 8 Helmholtz-Zentrum Geesthacht • Max-Planck-Straße 1 • 21502 Geesthacht • Phone +49 (0)4152 87-1862 • Fax +49 (0)4152 87-2832 • www.hzg.de Contact: Frederik Schenk [2] Compo et al., 2011, Q. J. R. Meteorol. Soc. 137 [4] Krüger & von Storch, 2011, J. Climate 24
