dft1demo1 file:///C:/swp41/Docs/courses/ma439/scripts/html/dft1demo1.html
advertisement

dft1demo1
1 of 3
file:///C:/swp41/Docs/courses/ma439/scripts/html/dft1demo1.html
dft1demo1
show a signal and an unshifted DFT pair
S. Allen Broughton - 29 Sep 10
Contents
define signal, sample rate, sample domain
display signal and DFT
display magnitude and phase
define signal, sample rate, sample domain
define sample points and parameters for signal definition
N = 128;
t = (0:1:(N-1))/N;
I = sqrt(-1);
SD = 0:(N-1); % sample or time as integer points
% uncomment the desired signal
%sig = 2*cos(5*2*pi*t)+0.5*sin(24*2*pi*t);
%sig = 2*cos(5*2*pi*t)+0.5*cos(24*2*pi*t);
k = round(0.1*N); sig = [ones(1,k),zeros(1,N-k)]*(N/k);
%k = 2; sig = [ones(1,k),zeros(1,N-k)]*(N/k);
%sig = rand(1,N);
%sig = 2*rand(1,N)-1;
%sig = 2*cos(5*2*pi*t)+ I*0.5*sin(24*2*pi*t);
% define frequency domain and get DFT
FD = 0:(N-1);
fsig = fft(sig);
display signal and DFT
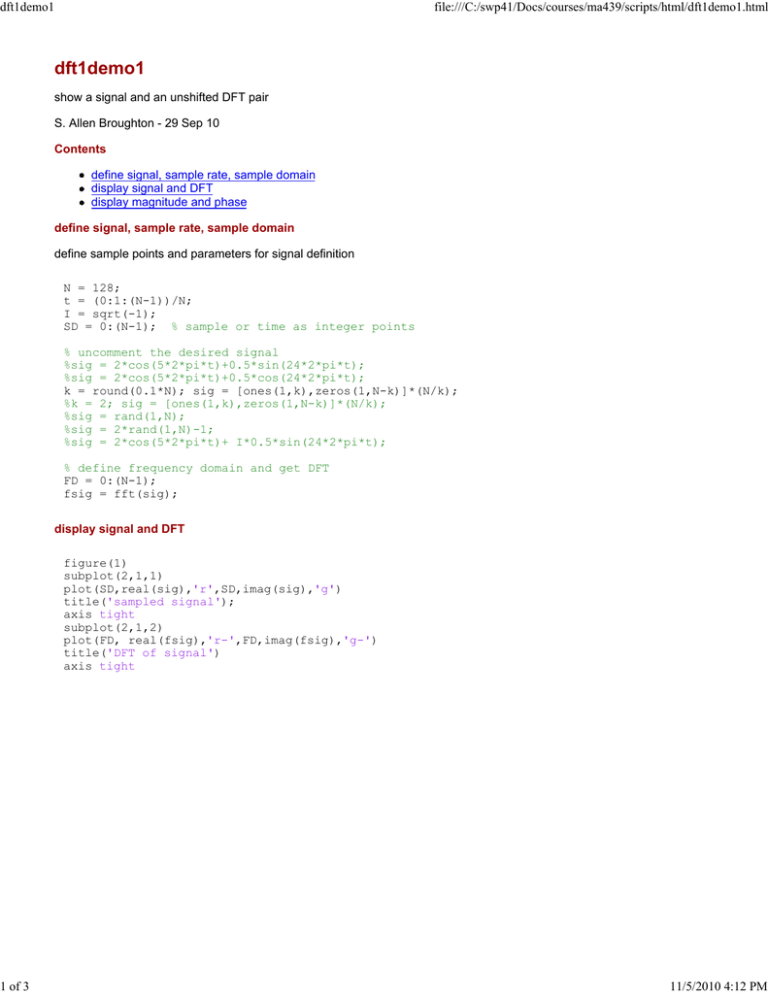
figure(1)
subplot(2,1,1)
plot(SD,real(sig),'r',SD,imag(sig),'g')
title('sampled signal');
axis tight
subplot(2,1,2)
plot(FD, real(fsig),'r-',FD,imag(fsig),'g-')
title('DFT of signal')
axis tight
11/5/2010 4:12 PM
dft1demo1
2 of 3
file:///C:/swp41/Docs/courses/ma439/scripts/html/dft1demo1.html
display magnitude and phase
note that the phase is meaningless if many of the coefficients are nearly zero
figure(2)
subplot(2,1,1)
plot(FD, abs(fsig),'r-' )
title('magnitude of DFT')
axis tight
subplot(2,1,2)
plot(FD, angle(fsig),'g-' )
title('phase of DFT')
axis tight
11/5/2010 4:12 PM
dft1demo1
3 of 3
file:///C:/swp41/Docs/courses/ma439/scripts/html/dft1demo1.html
Published with MATLAB® 7.8
11/5/2010 4:12 PM


