1 James, Maryanne, Bill, and Debbie work at Texas Cup
advertisement
1
Algebra I: Strand 2. Linear Functions; Topic 2. Formalizing Slope and y-Intercept; Task
2.2.1
TASK 2.2.1: CUPS, CUPS,
CUPS
Solutions
James, Maryanne, Bill, and Debbie work at Texas Cup
Company. They are each assigned to package different
sizes of cups for shipment in boxes. For each of the
following problem situations, fill in the table, make a
scatter plot, and write the function rule that models this
situation. Be sure to label the graph and the table.
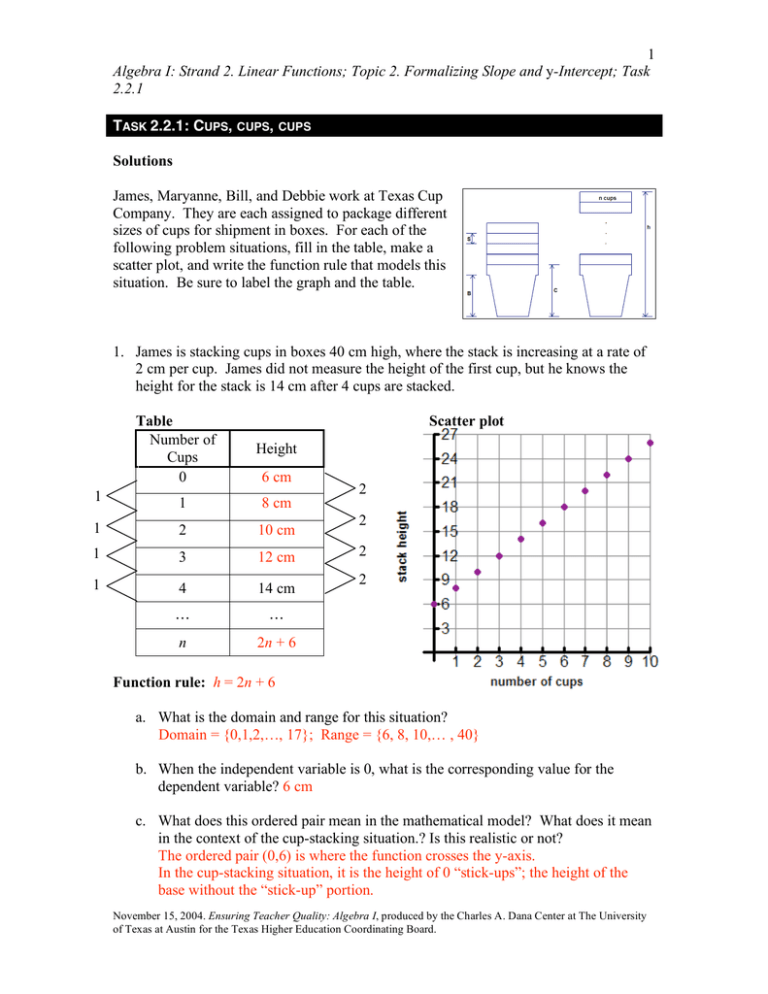
1. James is stacking cups in boxes 40 cm high, where the stack is increasing at a rate of
2 cm per cup. James did not measure the height of the first cup, but he knows the
height for the stack is 14 cm after 4 cups are stacked.
Table
Number of
Cups
0
Scatter plot
Height
6 cm
1
1
8 cm
1
2
10 cm
1
3
12 cm
1
4
14 cm
…
…
n
2n + 6
2
2
2
2
Function rule: h = 2n + 6
a. What is the domain and range for this situation?
Domain = {0,1,2,…, 17}; Range = {6, 8, 10,… , 40}
b. When the independent variable is 0, what is the corresponding value for the
dependent variable? 6 cm
c. What does this ordered pair mean in the mathematical model? What does it mean
in the context of the cup-stacking situation.? Is this realistic or not?
The ordered pair (0,6) is where the function crosses the y-axis.
In the cup-stacking situation, it is the height of 0 “stick-ups”; the height of the
base without the “stick-up” portion.
November 15, 2004. Ensuring Teacher Quality: Algebra I, produced by the Charles A. Dana Center at The University
of Texas at Austin for the Texas Higher Education Coordinating Board.
2
Algebra I: Strand 2. Linear Functions; Topic 2. Formalizing Slope and y-Intercept; Task
2.2.1
No, this is not realistic; cups are not sold without the “stick-up” portion.
d. The point (0,6) is called the y-intercept, why do you think it was given this
name? The function intersects the y-axis at the point (0,6).
cm
, allow you to create the table?
cup
Starting with a height of 14 cm for 4 cups, subtract 2 cm repeatedly from the
height for each cup less than 4, and add 2 cm to the height for each cup over 4.
e. How did the constant change in height, 2
f. Explain how you see this constant rate of change in the scatter plot.
To move from one point to the next point, move 1 cup horizontally and 2 cm
vertically to reach the next point.
g. The mathematical term for this constant rate of change is slope. Using your rule,
cm
identify the slope and the y-intercept. The slope is 2
. The y-intercept is 6
cup
cm.
h. Write a sentence to describe the mathematical rule in the context of the situation.
When cups with a base of 6 cm and a “stick-up” height of 2 cm are stacked, the
height of the stack increases 2 cm with the addition of each cup.
i. Predict the height of a stack of 10 cups. h = 2n + 6 = 2(10) + 6 = 26; height is 26 cm
j. If a stack of cups is 34 cm high, then how many cups are in the stack? 14 cups
November 15, 2004. Ensuring Teacher Quality: Algebra I, produced by the Charles A. Dana Center at The University
of Texas at Austin for the Texas Higher Education Coordinating Board.
3
Algebra I: Strand 2. Linear Functions; Topic 2. Formalizing Slope and y-Intercept; Task
2.2.1
2. Maryanne is creating a stack of cups 42 cm high, where the stack is increasing at a
rate of 2.5 cm per cup. Maryanne did not measure the height of the first cup, but she
knows the height of the stack is 24.5 cm after 8 cups are stacked.
2
2
2
2
Table
Number of
Cups
0
Scatter plot
Height
4.5 cm
2
9.5 cm
4
14.5 cm
6
19.5 cm
8
24.5 cm
…
…
n
2.5n + 4.5
5
5
5
5
Function rule: h = 2.5n + 4.5
a. Are the domain and range the same as in (1)? If not, then how did they change
and why? The domain is not the same as in (1). The domain ={0,1,2,…,15} and
the range ={4.5, 7, 9.5, …, 42}. The rule changed and the height of the box
changed which caused the domain and range to change.
b. When the independent variable is 0, what is the corresponding value for the
dependent variable? 4.5 cm
c. What does this ordered pair mean in the mathematical model? What does it mean
in the context of the cup stacking situation? Is this realistic or not?
The ordered pair (0, 4.5) is where the function crosses the y-axis.
In the stacking cup situation, it is the height of 0 “stick-ups”, that is the height of
the base without the “stickup” portion.
No, this is not realistic; cups are not sold without the “stickup” portion.
d. What is the y-intercept? (0, 4.5)
cm
, allow you to create the table?
cup
Starting with a height of 24.5 cm for 8 cups, subtract 2.5 cm repeatedly from the
height for each cup less than 8 or subtract 5.0 cm repeatedly from the height for
each set of 2 cups less than 8 cups.
e. How did the constant change in height, 2.5
November 15, 2004. Ensuring Teacher Quality: Algebra I, produced by the Charles A. Dana Center at The University
of Texas at Austin for the Texas Higher Education Coordinating Board.
4
Algebra I: Strand 2. Linear Functions; Topic 2. Formalizing Slope and y-Intercept; Task
2.2.1
f. Explain how you see this constant rate of change in the scatter plot. To move
from one point to the next point, move 1 cup horizontally and 2.5 cm vertically to
reach the next point, or move 2 cups horizontally and 5 cm vertically to reach the
next point on the scatter plot.
g. The mathematical term for constant rate of change is slope. Using your rule, identify
cm
the slope and the y-intercept. The slope is 2.5
. The y-intercept is 4.5 cm.
cup
h. Write a sentence to describe the mathematical rule.
When cups with a base of 4.5 cm and a “stickup” height of 2.5 cm are stacked, the
height of the stack increases 2.5 cm with the addition of each cup.
i. Predict the height of a stack of 15 cups.
h = 2.5n + 4.5 = 2.5(15) + 4.5 = 37.5 + 4.5 = 42.0
j. If a stack of cups is 34.5 cm high, then how many cups are in the stack?
12 cups
3. For the cups he was assigned, Bill noticed the height of 5 cups was 11.5 cm high and a
stack of 8 cups was 16 cm high. Bill was packaging his cups in boxes 40 cm high.
1
Table
Number of
Cups
0
Scatter plot
Height
4.0 cm
1.5
1
5.5 cm
3
8.5 cm
2
5
11.5cm
3
1
6
13.0 cm
1.5
2
8
16.0 cm
3
…
…
n
1.5n + 4
2
3
Function rule: h = 1.5n + 4
November 15, 2004. Ensuring Teacher Quality: Algebra I, produced by the Charles A. Dana Center at The University
of Texas at Austin for the Texas Higher Education Coordinating Board.
5
Algebra I: Strand 2. Linear Functions; Topic 2. Formalizing Slope and y-Intercept; Task
2.2.1
a. When the independent variable is 0, what is the corresponding value for the
dependent variable? 4.0 cm
b. What does this ordered pair mean in the mathematical model? What does it mean in
the context of the cup-stacking situation? Is this realistic or not?
The ordered pair (0,4) is where the function crosses the y-axis.
In the cup-stacking situation, it is the height of 0 “stick-ups”, the height of the base
without the “stick-up” portion.
No, this is not realistic; cups are not sold without the “stick-up” portion.
c. What is the constant change in height per cup added to the stack? 1.5 cm
d. Write a sentence to describe this function in words.
When cups with a base of 4.0 cm and a “stickup” height of 1.5 cm are stacked, the
height of the stack increases 1.5 cm with the addition of each cup.
e. Predict the height of a stack of 20 cups. h = 1.5n + 4 = 1.5(20) + 4 = 34;
height is 34 cm.
f. The mathematical term for constant rate of change is slope. Identify and explain the
slope and y-intercept using the table and graph.
Table:
cm
.
cup
The y-intercept is the value on the table that is associated with the input value
of 0.
Finite differences can be used here to determine that the slope is 1.5
Traditional Function Rule:
cm
8.5 " 5.5 3
The slope is
= = 1.5
.
cup
3 "1
2
The y-intercept is the value of the dependent variable that corresponds to 0
for the independent variable. The y-intercept is 4 cm.
!
November 15, 2004. Ensuring Teacher Quality: Algebra I, produced by the Charles A. Dana Center at The University
of Texas at Austin for the Texas Higher Education Coordinating Board.
6
Algebra I: Strand 2. Linear Functions; Topic 2. Formalizing Slope and y-Intercept; Task
2.2.1
Graph:
The slope is the ratio from one point to a second point of the vertical distance
to the horizontal distance. The y-intercept is the point where the function
intersects the y-axis.
g. If a stack of cups is 22 cm high, then how many cups are in the stack? 12
4. Debbie is stacking cups in boxes, each 41 cm high, for shipment. The height of the
cup without the stick-up” part is 5.5 cm. She measures the height of a stack of 5
cups. The height is 18 cm.
1
1
1
1
1
Table
Number of
Cups
0
Scatter plot
Height
5.5cm
2.5
1
8.0. cm
2
10.5 cm
3
13.0 cm
4
15.5 cm
2.5
5
18.0 cm
2.5
…
…
n
2.5n + 5.5
2.5
2.5
Function rule: h = 2.5n + 5.5
a. What is the domain and range for this situation? Explain. Domain= {0, 1, 2, …,
14}; Range={5.5, 8, 10.5, …, 40.5}; If you stack more that 14 cups, the height is
more than 40.5 cm. The range is the corresponding values to the domain values.
b. What does the ordered pair (0, 5.5) mean in the mathematical model? What does
it mean in the context of the cup-stacking situation? Is this realistic or not?
The ordered pair (0, 5.5) is where the function crosses the y-axis.
In the stacking cup situation, it is the height of 0 “stick-ups”, that is the height of
the base without the “stick-up”.
No, this is not realistic; base of the cups are not sold without the “stick-up”
c. For each additional cup, what is the change in the height? 2.5 cm
November 15, 2004. Ensuring Teacher Quality: Algebra I, produced by the Charles A. Dana Center at The University
of Texas at Austin for the Texas Higher Education Coordinating Board.
7
Algebra I: Strand 2. Linear Functions; Topic 2. Formalizing Slope and y-Intercept; Task
2.2.1
What is the mathematical term for this value? slope
d. How does the graph reflect the change in height? To move from one point to the
next point, move 1 cup horizontally and 2.5 cm vertically.
e. Write a sentence to describe the mathematical rule in the context of this situation.
When cups with a base of 5.5 cm and a “stick-up” height of 2.5 cm are stacked,
the height of the stack increases 2.5 cm with the addition of each cup.
f. Predict the height of a stack of 9 cups.
h = 2.5n + 5.5 = 2.5(9) + 5.5 = 22.5 + 5.5 = 28.0
g. The mathematical term for constant rate of change is slope. Identify and explain
the slope and y-intercept using the table and graph.
Table:
cm
Finite differences can be used here to determine that the slope is 2.5
.
cup
The y-intercept is the value on the table that is associated with the input value
of 0.
Traditional Function Rule:
The slope is the ratio of the change in the dependent variable for the
corresponding change in the independent variable.
cm
15.5 ! 13.0
2.5
The slope is
=
= 2.5
.
cup
4!3
1
The y-intercept is the value of the dependent variable that corresponds to 0
for the independent variable. The y-intercept is 5.5 cm.
Graph:
The slope is the ratio from one point to a second point, or the vertical
distance to the horizontal distance. The y-intercept is the point where the
function intersects the y-axis.
h. If a stack of cups is 23 cm high, then how many cups are in the stack? 7 cups
Teaching notes
The 4 problems presented here each have a different focus.
• The first provides a rate of change and requires students to complete the table.
The x values start with 0 and increase by 1.
• The second problem has x values changing by 2’s in the table and a rate of
change of 2.5.
November 15, 2004. Ensuring Teacher Quality: Algebra I, produced by the Charles A. Dana Center at The University
of Texas at Austin for the Texas Higher Education Coordinating Board.
8
Algebra I: Strand 2. Linear Functions; Topic 2. Formalizing Slope and y-Intercept; Task
2.2.1
•
•
The third problem gives the student 2 coordinates and they must compute the
rate of change and apply that information to complete the table.
The fourth problem provides the y-intercept and another point on the table.
Students must compute the rate of change and complete the table.
November 15, 2004. Ensuring Teacher Quality: Algebra I, produced by the Charles A. Dana Center at The University
of Texas at Austin for the Texas Higher Education Coordinating Board.
9
Algebra I: Strand 2. Linear Functions; Topic 2. Formalizing Slope and y-Intercept; Task
2.2.1
TASK 2.2.1: CUPS, CUPS,
CUPS
James, Maryanne, Bill, and Debbie work at Texas Cup
Company. They are each assigned to package different
sizes of cups for shipment in boxes. For each of the
following problem situations, label the table and graph.
Fill in the table, make a scatter plot, and write the
function that models this situation.
1. James is stacking cups in boxes 40 cm high, where the stack is increasing at a rate of
2 cm per cup. James did not measure the height of the first cup, but he knows the
height for the stack is 14 cm after 4 cups are stacked.
Table
Scatter plot
0
1
2
3
4
14 cm
…
…
n
Function rule:
a. What is the domain and range for this situation?
b. When the independent variable is 0, what is the corresponding value for the
dependent variable?
c. What does this ordered pair mean in the mathematical model? What does it mean
in the context of the cup stacking situation? Is this realistic or not?
d. The point (0,6) is called the y-intercept, why do you think it was given this
name?
November 15, 2004. Ensuring Teacher Quality: Algebra I, produced by the Charles A. Dana Center at The University
of Texas at Austin for the Texas Higher Education Coordinating Board.
10
Algebra I: Strand 2. Linear Functions; Topic 2. Formalizing Slope and y-Intercept; Task
2.2.1
e. How did the constant change in height, 2
cm
, allow you to create the table?
cup
f. Explain how you see this constant rate of change in the scatter plot.
g. The mathematical term for this constant rate of change is slope. Using your rule,
identify the slope and the y-intercept.
h. Write a sentence to describe the mathematical rule in the context of the situation.
i. Predict the height of a stack of 10 cups.
j. If a stack of cups is 34 cm high, then how many cups are in the stack?
2. Maryanne is creating a stack of cups 42 cm high, where the stack is increasing at a
rate of 2.5 cm per cup. Maryanne did not measure the height of the first cup, but she
knows the height of the stack is 24.5 cm after 8 cups are stacked.
Table
Scatter plot
0
2
4
6
8
24.5 cm
…
…
n
Function rule:
November 15, 2004. Ensuring Teacher Quality: Algebra I, produced by the Charles A. Dana Center at The University
of Texas at Austin for the Texas Higher Education Coordinating Board.
11
Algebra I: Strand 2. Linear Functions; Topic 2. Formalizing Slope and y-Intercept; Task
2.2.1
a. Are the domain and range the same as in (1)? If not, then how did they change
and why?
b. When the independent variable is 0, what is the corresponding value for the
dependent variable?
c. What does this ordered pair mean in the mathematical model? What does it mean
in the context of the cup stacking situation? Is this realistic or not?
d. What is the y-intercept?
e. How did the constant change in height, 2.5
cm
, allow you to create the table?
cup
f. Explain how you see this constant rate of change in the scatter plot.
g. The mathematical term for constant rate of change is slope. Using your rule, identify
the slope and the y-intercept.
h. Write a sentence to describe the mathematical rule.
i. Predict the height of a stack of 15 cups.
j. If a stack of cups is 34.5 cm high, then how many cups are in the stack?
November 15, 2004. Ensuring Teacher Quality: Algebra I, produced by the Charles A. Dana Center at The University
of Texas at Austin for the Texas Higher Education Coordinating Board.
12
Algebra I: Strand 2. Linear Functions; Topic 2. Formalizing Slope and y-Intercept; Task
2.2.1
3. For the cups he was assigned, Bill noticed the height of 5 cups was 11.5 cm. high and
a stack of 8 cups was 16 cm high. Bill was packaging his cups in boxes 40 cm high.
Table
Scatter plot
0
1
3
5
11.5 cm
6
8
16 cm
…
…
n
Function rule:
a. When the independent variable is 0, what is the corresponding value for the
dependent variable?
b. What does this ordered pair mean in the mathematical model? What does it mean in
the context of the cup stacking situation? Is this realistic or not?
c. What is the constant change in height per cup added to the stack?
d. Write a sentence to describe this function in words.
e. Predict the height of a stack of 20 cups.
f. The mathematical term for constant rate of change is slope. Identify and explain the
slope and y-intercept using the table and graph.
November 15, 2004. Ensuring Teacher Quality: Algebra I, produced by the Charles A. Dana Center at The University
of Texas at Austin for the Texas Higher Education Coordinating Board.
13
Algebra I: Strand 2. Linear Functions; Topic 2. Formalizing Slope and y-Intercept; Task
2.2.1
g. If a stack of cups is 22 cm high, how many cups are in the stack?
4. Debbie is stacking cups in boxes, each 41 cm high, for shipment. The height of the
cup without the “stick-up” part is 5.5 cm. She measures the height of a stack of 5
cups. The height is 18 cm.
Table
Scatter plot
0
1
2
3
4
5
18.0 cm
…
…
n
Function rule:
a. What is the domain and range for this situation? Explain.
b. What does the ordered pair (0, 5.5) mean in the mathematical model? What does
it mean in the context of the cup-stacking situation? Is this realistic or not?
c. For each additional cup, what is the change in the height?
What is the mathematical term for this value?
d. How does the graph reflect the change in height?
e. Write a sentence to describe the mathematical rule in the context of this situation.
November 15, 2004. Ensuring Teacher Quality: Algebra I, produced by the Charles A. Dana Center at The University
of Texas at Austin for the Texas Higher Education Coordinating Board.
14
Algebra I: Strand 2. Linear Functions; Topic 2. Formalizing Slope and y-Intercept; Task
2.2.1
f. Predict the height of a stack of 9 cups.
g. The mathematical term for constant rate of change is slope. Identify and explain
the slope and y-intercept using the table and graph.
h. If a stack of cups is 23 cm high, how many cups are in the stack?
November 15, 2004. Ensuring Teacher Quality: Algebra I, produced by the Charles A. Dana Center at The University
of Texas at Austin for the Texas Higher Education Coordinating Board.
