Document 11623744
advertisement

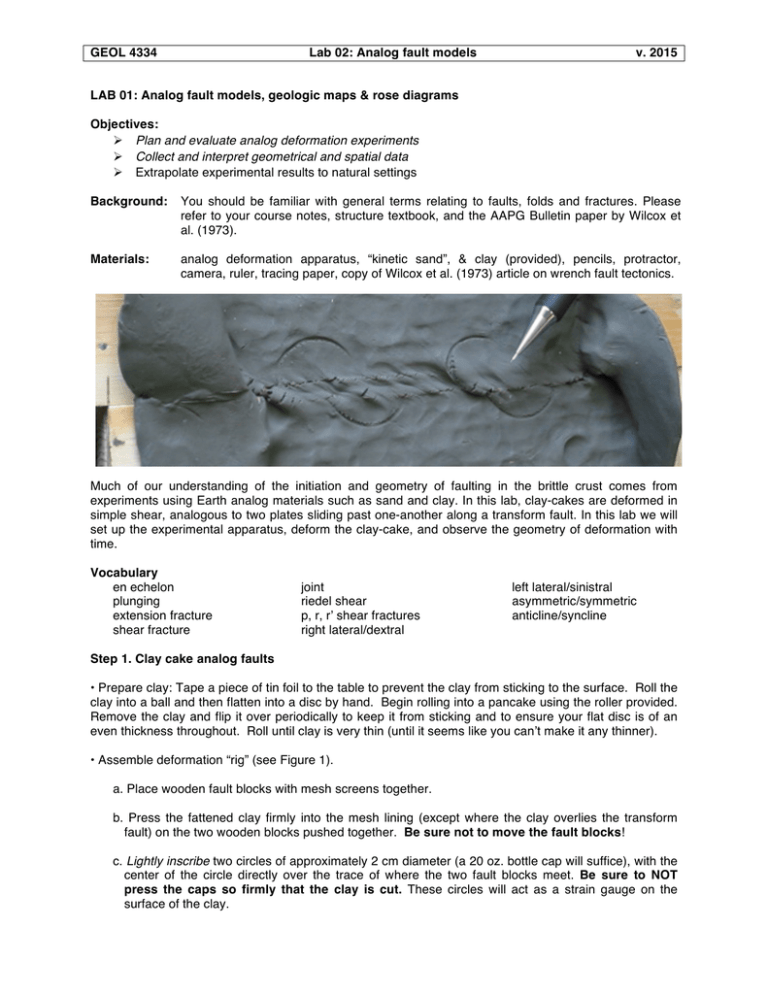
GEOL 4334 Lab 02: Analog fault models v. 2015 LAB 01: Analog fault models, geologic maps & rose diagrams Objectives: Ø Plan and evaluate analog deformation experiments Ø Collect and interpret geometrical and spatial data Ø Extrapolate experimental results to natural settings Background: You should be familiar with general terms relating to faults, folds and fractures. Please refer to your course notes, structure textbook, and the AAPG Bulletin paper by Wilcox et al. (1973). Materials: analog deformation apparatus, “kinetic sand”, & clay (provided), pencils, protractor, camera, ruler, tracing paper, copy of Wilcox et al. (1973) article on wrench fault tectonics. Much of our understanding of the initiation and geometry of faulting in the brittle crust comes from experiments using Earth analog materials such as sand and clay. In this lab, clay-cakes are deformed in simple shear, analogous to two plates sliding past one-another along a transform fault. In this lab we will set up the experimental apparatus, deform the clay-cake, and observe the geometry of deformation with time. Vocabulary en echelon plunging extension fracture shear fracture joint riedel shear p, r, r’ shear fractures right lateral/dextral left lateral/sinistral asymmetric/symmetric anticline/syncline Step 1. Clay cake analog faults • Prepare clay: Tape a piece of tin foil to the table to prevent the clay from sticking to the surface. Roll the clay into a ball and then flatten into a disc by hand. Begin rolling into a pancake using the roller provided. Remove the clay and flip it over periodically to keep it from sticking and to ensure your flat disc is of an even thickness throughout. Roll until clay is very thin (until it seems like you can’t make it any thinner). • Assemble deformation “rig” (see Figure 1). a. Place wooden fault blocks with mesh screens together. b. Press the fattened clay firmly into the mesh lining (except where the clay overlies the transform fault) on the two wooden blocks pushed together. Be sure not to move the fault blocks! c. Lightly inscribe two circles of approximately 2 cm diameter (a 20 oz. bottle cap will suffice), with the center of the circle directly over the trace of where the two fault blocks meet. Be sure to NOT press the caps so firmly that the clay is cut. These circles will act as a strain gauge on the surface of the clay. GEOL 4334 Lab 02: Analog fault models v. 2015 • Prepare the provided Table to compile your observations. a. Draw the initial experimental configuration on the Table. See Figure 1 for an example of how you should record your experimental results. b. Measure the initial diameter of the inscribed circles. • Use a metric ruler to note how much total displacement the blocks have undergone throughout the experiment. Step 2. • Begin deforming the clay-cake by sliding the two blocks past each other until you observe subtle changes on the surface of the clay. Be sure to keep the blocks pressed together during deformation. Slowly slide the blocks a total distance of about 1 cm (until notable structures begin to form) and then note the geometry of any structures you observe. Features you should consider and measure: trend, amplitude, wavelength of folds; trend of fractures, etc. Figure 1. Example of one page of a completed work sheet. • Continue sliding the blocks and note how the structures form and/or evolve over increments of displacement that best illustrate the changing structures (i.e., every 1 mm or 1 cm of displacement). On the provided table, sketch map and cross section views at 4 or 5 different increments of displacement to show how the structures evolve. See Fig. 1 for an example. GEOL 4334 Lab 02: Analog fault models v. 2015 • Use a protractor to record the trend of various features relative to the trace of the fault plane in map view (e.g., folds, synthetic or antithetic faults, etc.). Be sure to measure the trend with respect to the main fault trend (i.e., north) of at least 10 of each type of linear features that appear throughout the experiment and record this data in a table. These data will be plotted on a Rose diagram. Step 2. Kinetic Sand analog fractures • For the next experiment you will use “kinetic sand” instead of clay. Follow the same procedure as above to illuminate how fractures may develop during successive faulting events. Follow the same procedure as above but note the nature, orientation and evolution of fractures that form. Rose Diagrams Figure 2. Example Rose diagram of joint sets in class intervals of 5°. 12 0° 24 0° 0° 30 06 0° Rose diagrams represent a graphical means of portraying the trend of linear geologic data such as joints, fault traces, paleo-current directions, etc. A rose diagram is constructed on a circular grid composed of concentric circles and radial lines (see below). The radius of each concentric circle is one unit (n) greater than the previous circle. Units of distance measured along radius represent a quantity of measurements; therefore, Rose diagrams are a sort of “directional histogram” with a larger bar means more structures with that bearing. The number of measurements represented by a single unit along a radius is chosen so that the total number of linear elements measured (e.g., joints or paleo-current directions) in the most prominent data set can be represented N on a standard 20-cm diameter grid. 360° Usually, each concentric circle 03 ° represents one or two measurements. 0° 30 3 The orientation of a radius represents a compass bearing; hence the name ‘Rose’ diagram, for the cardinal directions. Radii are normally spaced at 5° intervals relative to north (but may be greater or lesser). Each 5° interval is called a class interval. The number E, 090° (n) of data whose bearings are in a W, 270° single class interval is plotted as a filled pie-shaped sector of length n at the scale of the diagram. 21 0° S, 0° 15 For your data you will want to plot two 180° rose diagrams, one that depicts the trend of faults/fractures (planar; strike) and another that depicts the orientation of fold traces (linear; trend). Note that with your data you may represent SE-trending lines with an equivalent NW-trending line. Therefore, all measurements may be converted and placed on the upper half of the rose diagram. Note that the above diagram has a monoclinic symmetry about an axis that trends through the origin. GEOL 4334 • Lab 02: Analog Faults Name: R#: TA: Lab 02 Questions Please answer the following questions in complete and concise sentences in the spaces below. In your answers please refer to your illustrations in the table, or draw new ones. If you wish, you may complete the lab by hand and with TA approval, you may take the finished handwritten work home and type up your results. If you do this, please be sure to include both your original and revised work AND Include this question sheet on the front of the report. DUE at the beginning of next week’s lab. 1) Describe the first structure(s) to form and their orientation with respect to the fault. For folds be sure to describe the wavelength, amplitude, and trend of the fold axis. Use terms that we have discussed in class such as “piercing points”, “asymmetric folds”, “en echelon faults”, etc. 2) During continued displacement, what happened to these structures? 3) During continued displacement, did new structures form? If so, describe their geometry and orientation? 4) Plot the orientation of the different structures on a rose diagram (see next page). Use separate pieces of tracing paper for structures of different orientations. Do different populations of structure form at predictable angles with respect to the fault? Use the rose diagram to illustrate and describe the average orientation of various structural features in the experiment. Do not copy from your neighbor nor from any text; that is called PLAGARISM – use your own words. This project is to be done independently. If multiple reports appear similar, each report will be given a ‘0’. Assignments may not be emailed to the TA or professor. Additional tables may be used. GEOL 4334 • Lab 02: Analog Faults Name: N 360° TA: 03 0° 30 0 0° 06 ° 0° 3 3 R#: E, 090° 0° 12 24 0° W, 270° 21 0° Rose diagram template. S, 180° 0° 5 1 NOTES NOTES SLIP (mm) SLIP (mm) MAP VIEW MAP VIEW CROSS SECTION VIEW Measurements: CROSS SECTION VIEW Measurements: CLAY CAKE WORKSHEET page ____ of ____


