STATISTICS 402 – Assignment 8 Due April 18, 2007
advertisement
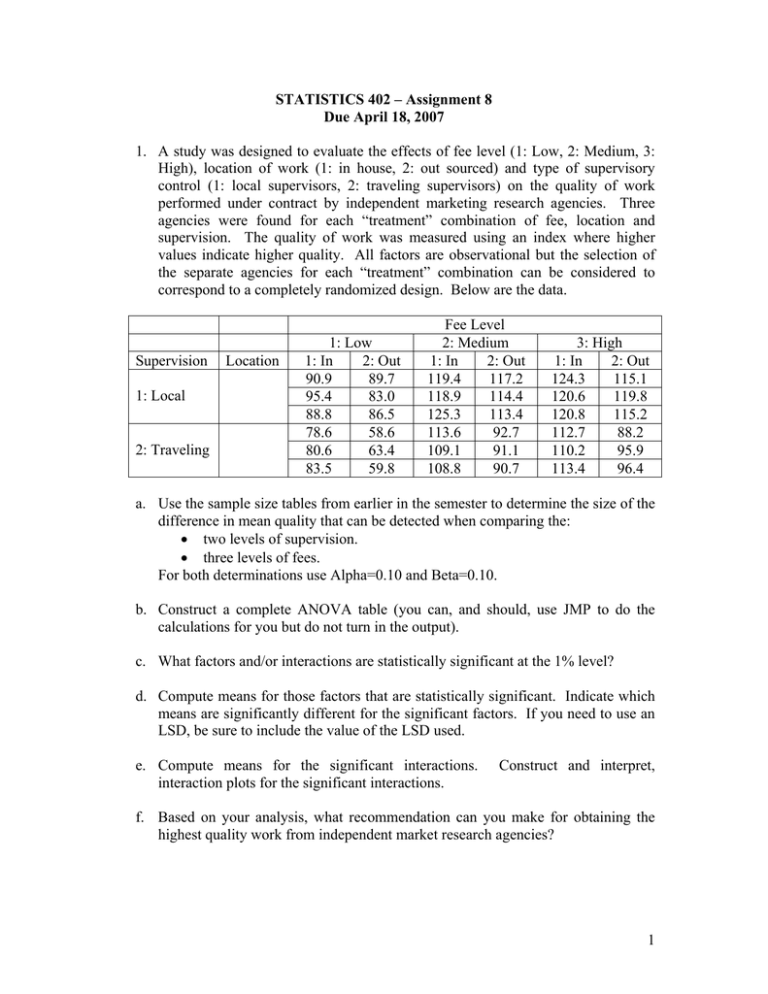
STATISTICS 402 – Assignment 8 Due April 18, 2007 1. A study was designed to evaluate the effects of fee level (1: Low, 2: Medium, 3: High), location of work (1: in house, 2: out sourced) and type of supervisory control (1: local supervisors, 2: traveling supervisors) on the quality of work performed under contract by independent marketing research agencies. Three agencies were found for each “treatment” combination of fee, location and supervision. The quality of work was measured using an index where higher values indicate higher quality. All factors are observational but the selection of the separate agencies for each “treatment” combination can be considered to correspond to a completely randomized design. Below are the data. Supervision 1: Local 2: Traveling Location 1: Low 1: In 2: Out 90.9 89.7 95.4 83.0 88.8 86.5 78.6 58.6 80.6 63.4 83.5 59.8 Fee Level 2: Medium 1: In 2: Out 119.4 117.2 118.9 114.4 125.3 113.4 113.6 92.7 109.1 91.1 108.8 90.7 3: High 1: In 2: Out 124.3 115.1 120.6 119.8 120.8 115.2 112.7 88.2 110.2 95.9 113.4 96.4 a. Use the sample size tables from earlier in the semester to determine the size of the difference in mean quality that can be detected when comparing the: • two levels of supervision. • three levels of fees. For both determinations use Alpha=0.10 and Beta=0.10. b. Construct a complete ANOVA table (you can, and should, use JMP to do the calculations for you but do not turn in the output). c. What factors and/or interactions are statistically significant at the 1% level? d. Compute means for those factors that are statistically significant. Indicate which means are significantly different for the significant factors. If you need to use an LSD, be sure to include the value of the LSD used. e. Compute means for the significant interactions. interaction plots for the significant interactions. Construct and interpret, f. Based on your analysis, what recommendation can you make for obtaining the highest quality work from independent market research agencies? 1 2. An experiment is conducted to explore the relationship between height of step (5.75 in or 11.5 in) and rate of stepping (14 steps/min, 21 steps/min or 28 steps/min) on the heart rate of college students. Six college students were used in the study. There are 6 combinations of step height and stepping rate. Each student experienced each combination. The order was randomized for each student and enough time separated the trials so that students’ heart rates could return to a resting rate. The resting heart rate for each student is taken before each trial and the heart rate at the end of the 3 minutes of the stepping regimen is also measured. Below are the data. The values are the change in heart rate from resting to after stepping. Student 1 2 3 4 5 6 Step Height 14 steps/min 5.75 in 11.5 in 15 39 9 33 8 18 9 15 16 26 4 15 Stepping Frequency 21 steps/min 28 steps/min 5.75 in 11.5 in 5.75 in 11.5 in 21 52 24 66 21 50 42 60 24 27 27 51 15 28 18 40 28 49 43 72 15 16 20 39 a. Construct a complete ANOVA table for the analysis of the change in heart rate. You can use JMP to do the calculations for you but do not turn in the output. b. What, if any, factors and interactions are significant? statistically. Support your answers c. If a factor is significant, what levels are significantly different from other levels? If you need to use an LSD, be sure to give the value of the LSD used. d. Construct and interpret an appropriate interaction plot. e. Based on your analysis, comment on the effects of step height and rate of stepping on the change in heart rate. f. How important was blocking on the student in this experiment? Support your answer with a statistical argument. This may involve additional analysis. 2
