STATISTICS 402 - Assignment 8 (Due April 21, 2006)
advertisement
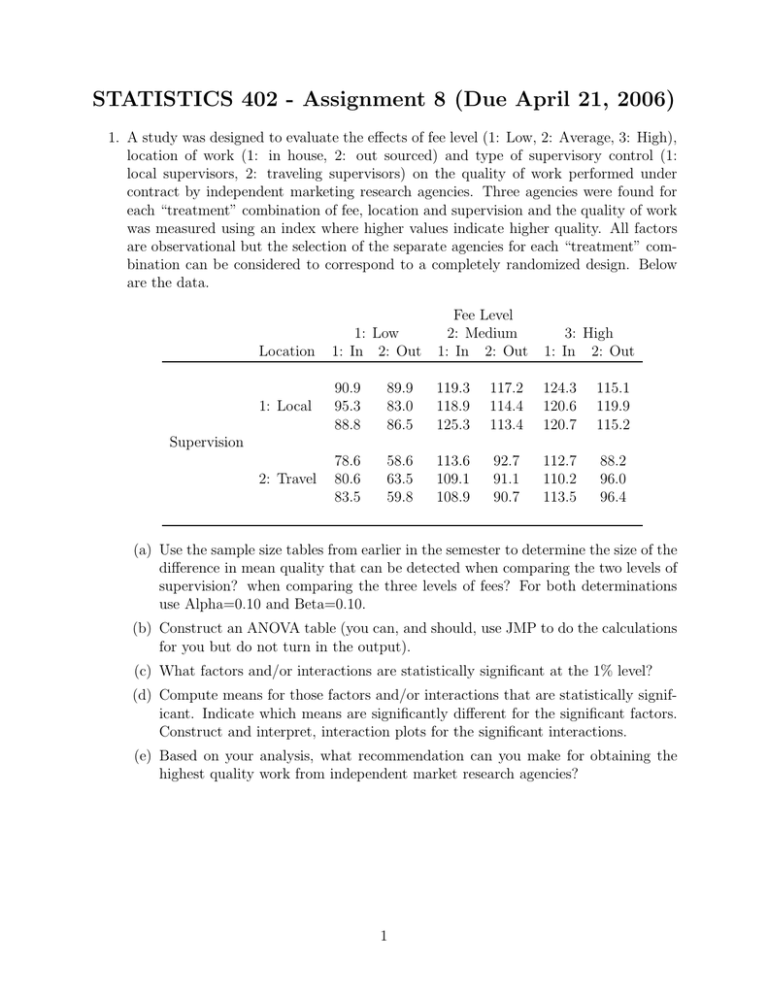
STATISTICS 402 - Assignment 8 (Due April 21, 2006) 1. A study was designed to evaluate the effects of fee level (1: Low, 2: Average, 3: High), location of work (1: in house, 2: out sourced) and type of supervisory control (1: local supervisors, 2: traveling supervisors) on the quality of work performed under contract by independent marketing research agencies. Three agencies were found for each “treatment” combination of fee, location and supervision and the quality of work was measured using an index where higher values indicate higher quality. All factors are observational but the selection of the separate agencies for each “treatment” combination can be considered to correspond to a completely randomized design. Below are the data. 1: Low 1: In 2: Out Fee Level 2: Medium 1: In 2: Out 3: High 1: In 2: Out 1: Local 90.9 95.3 88.8 89.9 83.0 86.5 119.3 118.9 125.3 117.2 114.4 113.4 124.3 120.6 120.7 115.1 119.9 115.2 2: Travel 78.6 80.6 83.5 58.6 63.5 59.8 113.6 109.1 108.9 92.7 91.1 90.7 112.7 110.2 113.5 88.2 96.0 96.4 Location Supervision (a) Use the sample size tables from earlier in the semester to determine the size of the difference in mean quality that can be detected when comparing the two levels of supervision? when comparing the three levels of fees? For both determinations use Alpha=0.10 and Beta=0.10. (b) Construct an ANOVA table (you can, and should, use JMP to do the calculations for you but do not turn in the output). (c) What factors and/or interactions are statistically significant at the 1% level? (d) Compute means for those factors and/or interactions that are statistically significant. Indicate which means are significantly different for the significant factors. Construct and interpret, interaction plots for the significant interactions. (e) Based on your analysis, what recommendation can you make for obtaining the highest quality work from independent market research agencies? 1 2. An experiment is conducted to explore the relationship between height of step (5.75 in or 11.5 in) and rate of stepping (14 steps/min, 21 steps/min or 28 steps/min) on the change in heart rate of college students. There are 6 treatment combinations of step height and stepping rate (A: 14 and 5.75, B: 14 and 11.5, C: 21 and 5.75, D: 21 and 11.5, E: 28 and 5.75, and F: 28 and 11.5). Six college students were used in the study. To avoid fatigue the students visited the exercise lab on 6 different days. Each student experienced each combination on one day. The experiment was run as a Latin Square Design. The data are presented below with the response being the change in heart rate. A value of 21 indicates that the exercise raised the heart rate of that individual to 21 beats a minute more than when the individual was at rest. Student 1 2 3 4 5 6 1 C 21 A 9 E 29 D 28 F 68 B 15 2 F 62 D 50 B 8 A 9 C 28 E 22 Day 3 4 D E 52 26 B C 33 21 F A 47 8 E F 20 36 A B 16 26 C D 15 16 5 A 15 E 44 C 17 B 15 D 49 F 35 6 B 39 F 56 D 27 C 15 E 45 A 4 (a) What are the factors of interest? (b) What are the nuisance factors? (c) Analyze the change in heart rate. You can use JMP to do the calculations for you but do not turn in the output. Instead, take from the output only those parts that you feel are important. Be sure to include: The full ANOVA table listing all sources of variation, degrees of freedom, sums of squares, mean squares and meaningful F-tests and P-values. What, if any, factors and interactions are statistically significant. If a factor is significant, what levels have sample means that are significantly different from those at other levels. An appropriate interaction plot and an interpretation. 2
