STATISTICS 402 - Assignment 6 (Due April 1, 2005)
advertisement

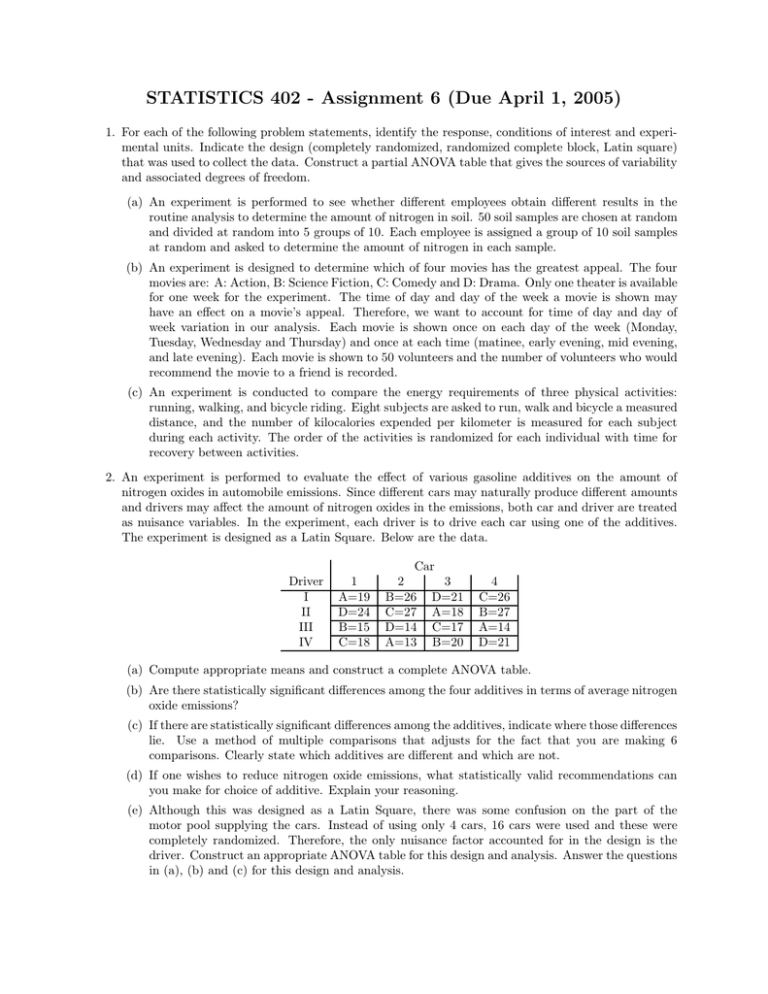
STATISTICS 402 - Assignment 6 (Due April 1, 2005) 1. For each of the following problem statements, identify the response, conditions of interest and experimental units. Indicate the design (completely randomized, randomized complete block, Latin square) that was used to collect the data. Construct a partial ANOVA table that gives the sources of variability and associated degrees of freedom. (a) An experiment is performed to see whether different employees obtain different results in the routine analysis to determine the amount of nitrogen in soil. 50 soil samples are chosen at random and divided at random into 5 groups of 10. Each employee is assigned a group of 10 soil samples at random and asked to determine the amount of nitrogen in each sample. (b) An experiment is designed to determine which of four movies has the greatest appeal. The four movies are: A: Action, B: Science Fiction, C: Comedy and D: Drama. Only one theater is available for one week for the experiment. The time of day and day of the week a movie is shown may have an effect on a movie’s appeal. Therefore, we want to account for time of day and day of week variation in our analysis. Each movie is shown once on each day of the week (Monday, Tuesday, Wednesday and Thursday) and once at each time (matinee, early evening, mid evening, and late evening). Each movie is shown to 50 volunteers and the number of volunteers who would recommend the movie to a friend is recorded. (c) An experiment is conducted to compare the energy requirements of three physical activities: running, walking, and bicycle riding. Eight subjects are asked to run, walk and bicycle a measured distance, and the number of kilocalories expended per kilometer is measured for each subject during each activity. The order of the activities is randomized for each individual with time for recovery between activities. 2. An experiment is performed to evaluate the effect of various gasoline additives on the amount of nitrogen oxides in automobile emissions. Since different cars may naturally produce different amounts and drivers may affect the amount of nitrogen oxides in the emissions, both car and driver are treated as nuisance variables. In the experiment, each driver is to drive each car using one of the additives. The experiment is designed as a Latin Square. Below are the data. Driver I II III IV 1 A=19 D=24 B=15 C=18 Car 2 3 B=26 D=21 C=27 A=18 D=14 C=17 A=13 B=20 4 C=26 B=27 A=14 D=21 (a) Compute appropriate means and construct a complete ANOVA table. (b) Are there statistically significant differences among the four additives in terms of average nitrogen oxide emissions? (c) If there are statistically significant differences among the additives, indicate where those differences lie. Use a method of multiple comparisons that adjusts for the fact that you are making 6 comparisons. Clearly state which additives are different and which are not. (d) If one wishes to reduce nitrogen oxide emissions, what statistically valid recommendations can you make for choice of additive. Explain your reasoning. (e) Although this was designed as a Latin Square, there was some confusion on the part of the motor pool supplying the cars. Instead of using only 4 cars, 16 cars were used and these were completely randomized. Therefore, the only nuisance factor accounted for in the design is the driver. Construct an appropriate ANOVA table for this design and analysis. Answer the questions in (a), (b) and (c) for this design and analysis.


