PAY FOR PERFORMANCE: THE UK EXPERIENCE
advertisement

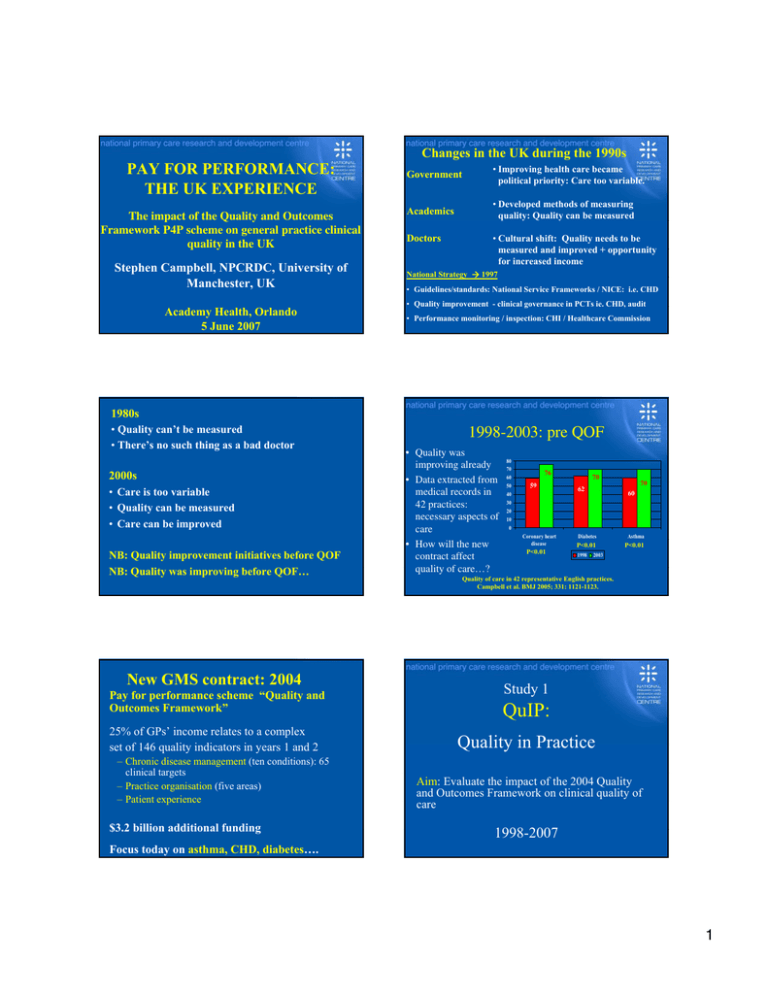
Changes in the UK during the 1990s PAY FOR PERFORMANCE: THE UK EXPERIENCE The impact of the Quality and Outcomes Framework P4P scheme on general practice clinical quality in the UK Stephen Campbell, NPCRDC, University of Manchester, UK Academy Health, Orlando 5 June 2007 Government • Improving health care became political priority: Care too variable. Academics • Developed methods of measuring quality: Quality can be measured Doctors • Cultural shift: Quality needs to be measured and improved + opportunity for increased income National Strategy Æ 1997 • Guidelines/standards: National Service Frameworks / NICE: i.e. CHD • Quality improvement - clinical governance in PCTs ie. CHD, audit • Performance monitoring / inspection: CHI / Healthcare Commission 1980s • Quality can’t be measured • There’s no such thing as a bad doctor 2000s • Care is too variable • Quality can be measured • Care can be improved NB: Quality improvement initiatives before QOF NB: Quality was improving before QOF… New GMS contract: 2004 Pay for performance scheme “Quality and Outcomes Framework” 25% of GPs’ income relates to a complex set of 146 quality indicators in years 1 and 2 – Chronic disease management (ten conditions): 65 clinical targets – Practice organisation (five areas) – Patient experience $3.2 billion additional funding 1998-2003: pre QOF • Quality was improving already • Data extracted from medical records in 42 practices: necessary aspects of care • How will the new contract affect quality of care…? 80 70 60 50 40 30 20 10 0 76 59 Coronary heart disease P<0.01 70 70 62 60 Diabetes Asthma P<0.01 P<0.01 1998 2003 Quality of care in 42 representative English practices. Campbell et al. BMJ 2005; 331: 1121-1123. Study 1 QuIP: Quality in Practice Aim: Evaluate the impact of the 2004 Quality and Outcomes Framework on clinical quality of care 1998-2007 Focus today on asthma, CHD, diabetes…. 1 QuIP Data collection points Data measured at two points before (1998 and 2003) and again after (2005 and 2007) the introduction of the new contract / QOF. PRE-QOF POST-QOF NGMS/ QOF 1998 2003 2005 2007 Sample: 42 nationally representative practices Method: Data extracted from medical records of random cross-sectional samples of patients with asthma, CHD and diabetes in each year Patient sample: 2300 patients in 1998, 1495 in 2003, and 1882 in 2005. Analyses: Performance in 2005 was compared to that predicted by a logit model, based on observed trends between 1998 and 2003. Longitudinal time-series design (4 cross sectional samples) 1998-2005 • Quality is still improving • Is the rate of improvement significantly more than what was expected from previous trends? • In other words: is there a QOF effect? 90 80 70 60 50 40 30 20 10 0 81 85 76 59 Coronary heart disease QOF effect? Better than expected? Mean practice achievement scores 2005 Angina Diabetes Asthma Actual score 85 81.4 84.3 Predicted on logit model 80.7 73.2 72.3 0.066 0.002 <0.001 84 70 70 62 60 (based on 1998-2003 trend) Diabetes 1998 2003 Asthma Significance of difference 2005 Study 2 QOF-A Aim: Evaluate the performance of all practices in England- all targets in QOF 2004 – Doran T, Fullwood C, Gravelle H et al. Family practice performance in the first year of the UK’s new pay for performance scheme: good clinical practice or ‘gaming’? New England Journal of Medicine 2006; 355: 375-384. QOF-A Sample: All practices in England submitting data on QOF. 7935 practices – where data from both years are available Method: Data extracted automatically from clinical computing systems for practices in the first (2004/05) and second years (2005/06) of the scheme. Analyses: Reported achievement on targets: % of patients deemed eligible for whom a quality indicator was met (population achievement) Focus today: 10 disease areas: 65 clinical targets 2 Practice performance in Years 1 and 2 1000 • Overall weighted reported achievement across all 10 conditions (65 targets) • High levels of achievement: even higher in year 2 • Year 1: Higher than expected by government 2005-6 Median Overall 83.4% 87.1% CHD 85.7% 88.7% Diabetes 80.1% 83.7% Asthma 80.5% 83.6% 0 200 400 600 Frequency 800 2004-5 Median 0 20 40 60 80 100 Types of indicator: Achievement for level of control etc (diabetes) 90 85 94 80 overall BMI smoking BP HBA1c 2005-06 76 Study 1: QuIP: The pay-for-performance scheme was associated with accelerated quality improvement for asthma and diabetes but not heart disease. 71 59 overall 84 96 96 96 Conclusion 80 72 98 97 94 Study 2 -QOF-A: Very high levels of achievement across all chronic conditions in years 1 and 2 higher than that predicted by the government. 84 80 100 95 90 85 80 75 70 65 60 55 50 2004-05 Percentage achievement 100 95 90 85 80 75 70 65 60 55 50 Types of indicator: Achievement for recording of…(diabetes) Chol <5 2004-05 61 HBA1c <7.4 BP <140/85 2005-06 Against a background of already improving quality of care in the UK for these chronic conditions, pay-forperformance may be a useful means of augmenting other approaches to quality improvement. Thank you for listening... Questions / comments ? stephen.campbell@manchester.ac.uk 3


