Surveillance, Epidemiology, and End Results (SEER) - Medicare Linked Database
advertisement
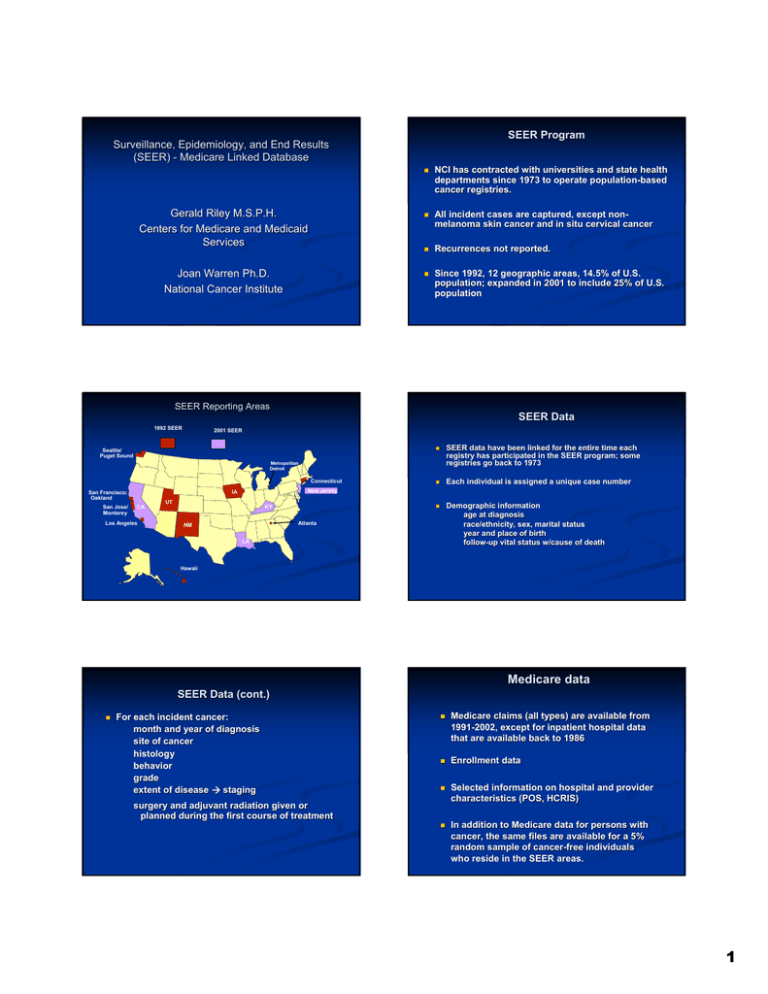
SEER Program Surveillance, Epidemiology, and End Results (SEER) - Medicare Linked Database NCI has contracted with universities and state health departments since 1973 to operate populationpopulation-based cancer registries. Gerald Riley M.S.P.H. Centers for Medicare and Medicaid Services All incident cases are captured, except nonnonmelanoma skin cancer and in situ cervical cancer Recurrences not reported. Joan Warren Ph.D. National Cancer Institute Since 1992, 12 geographic areas, 14.5% of U.S. population; expanded in 2001 to include 25% of U.S. population SEER Reporting Areas SEER Data 1992 SEER 2001 SEER Seattle/ Puget Sound SEER data have been linked for the entire time each registry has participated in the SEER program; some registries go back to 1973 Each individual is assigned a unique case number Demographic information age at diagnosis race/ethnicity, sex, marital status year and place of birth followfollow-up vital status w/cause of death Metropolitan Detroit Connecticut San Jose/ Monterey New Jersey IA San Francisco/ Oakland CA Los Angeles UT KY Atlanta NM LA Hawaii Medicare data SEER Data (cont.) For each incident cancer: month and year of diagnosis site of cancer histology behavior grade extent of disease Æ staging Medicare claims (all types) are available from 19911991-2002, except for inpatient hospital data that are available back to 1986 Enrollment data Selected information on hospital and provider characteristics (POS, HCRIS) In addition to Medicare data for persons with cancer, the same files are available for a 5% random sample of cancercancer-free individuals who reside in the SEER areas. surgery and adjuvant radiation given or planned during the first course of treatment 1 Current update Other variables available for cancer and nonnon-cancer cases Census variables at the census tract and zip code level for: Median household income Median household wealth % of population with high school education Population density Urban, suburban, rural codes Linkage is updated every 3 years Current update began Fall 2004 Preliminary match completed Added SEER cases for 20002000-2002 Added data from 4 new registries – Louisiana Kentucky New Jersey Greater California Data from new registries will be for 20012001-2002 Release date not yet scheduled Health Care Service Area from Area Resource File Matched cases by registry 1991 - 2002 (preliminary) Total Los Angeles 1991 - 2002 Detroit 1991 - 2002 Connecticut 1991 - 2002 Seattle – Puget Sound 1991 - 2002 San Francisco – Oakland 1991 - 2002 Iowa 1991 - 2002 Greater California 2001 - 2002 Atlanta 1991 - 2002 San Jose – Monterey 1991 - 2002 New Jersey 2001 - 2002 New Mexico 1991 - 2002 Utah 1991 - 2002 Kentucky 2001 - 2002 Louisiana 2001 - 2002 Hawaii 1991 - 2002 Rural Georgia 1991 - 2002 Matched cases by year of diagnosis 1991 – 2002 (preliminary) 250000 1,647,756 290,886 193,141 167,463 157,583 156,625 149,034 104,227 71,890 71,168 66,151 58,869 52,863 30,241 28,850 44,225 4,540 200000 150000 100000 50000 0 1991 1992 1993 1994 1995 1996 1997 1998 1999 2000 2001 2002 Matched cases by selected cancer sites, 1991 – 2002 (preliminary) Prostate Breast Lung and bronchus Colon and rectum Urinary bladder NonNon-Hodgkins lymphoma 302,898 240,426 224,429 214,826 78,620 58,996 Matched cases by selected cancer sites, 1991 – 2002 (preliminary) Pancreas Ovary Larynx Esophagus Brain Liver 38,031 24,236 15,193 15,060 13,797 13,609 2 Example of a Study of Post-diagnostic Surveillance using the SEER-Medicare Data: Frequency of Cystoscopy Following a Diagnosis of Superficial Bladder Cancer Examples of Studies Using SEER-Medicare Data Patients diagnosed with superficial bladder cancer who have not undergone total cystectomy are at high risk for recurrence Bladder surveillance with cystoscopy is recommended for such patients every 3-6 months Investigators used the SEER-Medicare data to examine the frequency with which these patients underwent cystoscopy during each of five contiguous 6-month intervals from month 7 to month 36 following diagnosis Surveillance among Medicare Eligible Patients with Superficial Bladder Cancer over a 3030-month interval following diagnosis, by Age Group Results/Conclusion 100 % Receiving Followup 90 80 Only 40% of the entire cohort had an examination during all five intervals Exams were significantly lower for old olds, blacks and persons living in rural areas The actual practice of surveillance for patients with superficial bladder cancer differs substantially from the standards recommended in clinical guidelines 70 60 50 65-69 70-74 75-79 80-84 85+ 40 30 20 10 0 1+ 2+ 3+ 4+ 5 Number of Followups Source: Schrag D et al. Adherence to surveillance among patients with superficial bladder cancer. J Natl Cancer Inst. 2003 Apr 16;95(8):588-97. Example of a Volume-Outcome Study Using the SEERMedicare data: Hospital and Surgeon Volume and Outcomes following Prostatectomy Studies of outcomes of cancer surgery have demonstrated variations among hospitals and among surgeons by procedure volume Investigators used SEER-Medicare data to examine variations in morbidity after radical prostatectomy, focusing on hospital and surgeon volume 35 30 25 Percent Percentage of Patients Experiencing Late Complications (stricture or fistula) Within One Year of Radical Prostatectomy, by Volume of Procedures 20 Hospitals 15 Physicians 10 5 0 Low Medium High Very High Volume of procedures Source: Begg CB et al. Variations in morbidity after radical prostatectomy. N Engl J Med. 2002 Apr 11;346(15):1138-44. 3 Limitations of SEERSEER-Medicare data Results/Conclusion For men undergoing prostatectomy, the rates of postoperative and late urinary complications are significantly reduced if the procedure is performed in a high-volume hospital and by a surgeon who performs a high number of such procedures However, even with high-volume surgeons, there was substantial variation in outcome among individual surgeons after adjustment for hospital volume and case mix Does not include claims for care provided to persons in HMOs (about 22% in SEER areas) NonNon-covered services excluded - prescription drugs, nursing home care, free screenings Under 65 population includes only the disabled/ESRD Reasons for tests are not known; this raises challenges with identifying screening Results of tests not available Support for SEERSEER-Medicare data users How to obtain SEER-Medicare data SEER-Medicare are de-identified. Because of the remote possibility of re-identification, these data are not available as public use files. Researchers must submit to NCI a proposal or copy of grant submission that describes Use of the data How data will be protected Investigators using the data SEER-Medicare data use agreement SEERSEER-Medicare WEB site: http://healthservices.cancer.gov/seermedicare http://healthservices.cancer.gov/seermedicare// Medical Care Vol. 40, no. 8 August 2002 Supplement SEER web site: http://seer.cancer.gov Publications, Manuals, Cancer Statistics, Scientific Systems: SEER*Stat, DEVCAN, etc. RESDAC support for Medicare data users http://www.resdac.umn.edu/ Funding Opportunities NCI Program Announcement http://appliedresearch.cancer.gov/funding.html http://appliedresearch.cancer.gov/funding.html Note: Cancer Surveillance Using Health ClaimsClaims-Based Data System Note: Economic Studies in Cancer Prevention, Screening, and Care 4
