The Economic Impact of Pharmaceutical Parallel Trade: A Stakeholder Analysis Agenda
advertisement
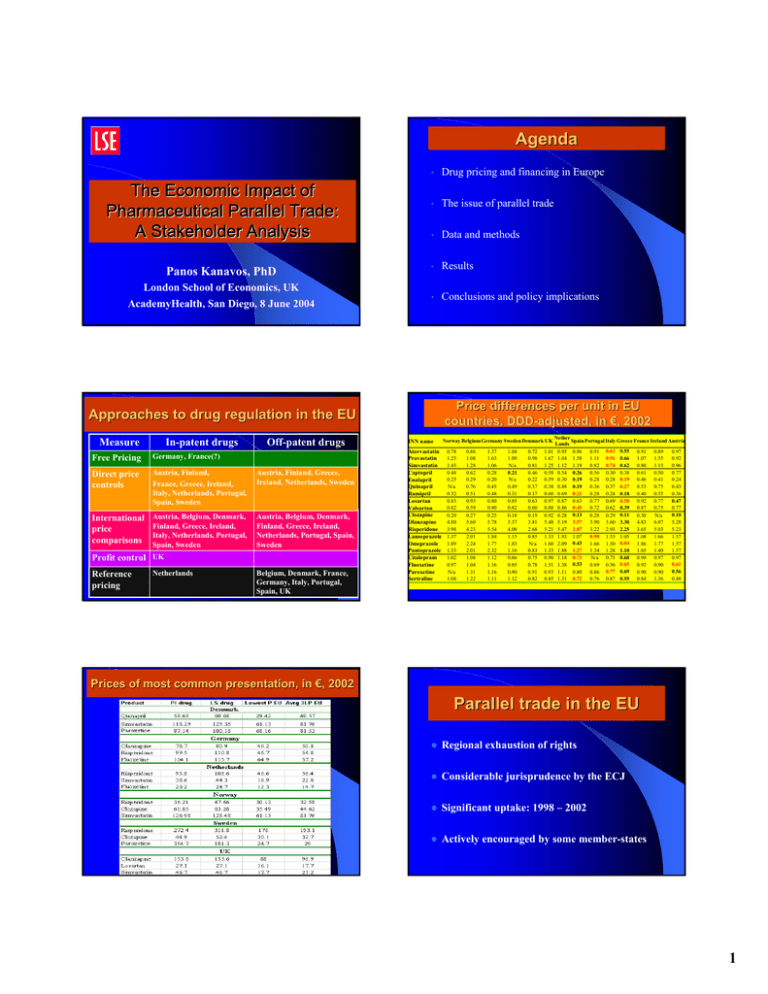
Agenda The Economic Impact of Pharmaceutical Parallel Trade: A Stakeholder Analysis Panos Kanavos, PhD London School of Economics, UK AcademyHealth, San Diego, 8 June 2004 • Drug pricing and financing in Europe • The issue of parallel trade • Data and methods • Results • Conclusions and policy implications Price differences per unit in EU countries, DDDDDD-adjusted, in €, 2002 Approaches to drug regulation in the EU Measure In-patent drugs Off-patent drugs Free Pricing Germany, France(?) Direct price controls Austria, Finland, France, Greece, Ireland, Italy, Netherlands, Portugal, Spain, Sweden Austria, Finland, Greece, Ireland, Netherlands, Sweden International price comparisons Austria, Belgium, Denmark, Finland, Greece, Ireland, Italy, Netherlands, Portugal, Spain, Sweden Austria, Belgium, Denmark, Finland, Greece, Ireland, Netherlands, Portugal, Spain, Sweden Profit control UK Reference pricing Netherlands Belgium, Denmark, France, Germany, Italy, Portugal, Spain, UK Norway Belgium Germany Sweden Denmark UK INN name Atorvastatin Pravastatin Simvastatin Captopril Enalapril Quinapril Ramipril Losartan Valsartan Clozapine Olanzapine Risperidone Lansoprazole Omeprazole Pantoprazole Citalopram Fluoxetine Paroxetine Sertraline 0.78 1.25 1.43 0.48 0.25 N/a 0.32 0.83 0.82 0.20 4.80 3.98 1.37 1.89 1.33 1.02 0.97 N/a 1.08 0.86 1.08 1.28 0.62 0.29 0.76 0.51 0.93 0.59 0.27 5.60 4.23 2.01 2.24 2.01 1.08 1.04 1.31 1.22 1.37 1.63 1.06 0.28 0.20 0.45 0.48 0.80 0.80 0.25 5.78 5.54 1.84 1.77 2.32 1.12 1.16 1.16 1.11 1.04 1.00 N/a 0.21 N/a 0.49 0.31 0.85 0.82 0.18 5.37 4.08 1.15 1.83 1.16 0.66 0.85 0.90 1.12 0.72 0.98 0.81 0.46 0.22 0.37 0.17 0.63 0.60 0.19 3.81 2.68 0.85 N/a 0.83 0.75 0.78 0.91 0.82 1.01 1.67 1.25 0.58 0.59 0.38 0.60 0.97 0.88 0.92 5.48 5.21 1.33 1.60 1.33 0.90 1.51 0.93 0.85 Nether Spain Portugal Italy Greece France Ireland Austria Lands 0.95 0.96 0.91 0.63 0.55 0.91 0.89 0.97 1.04 1.58 1.11 0.91 0.66 1.07 1.55 0.92 1.12 1.19 0.82 0.74 0.62 0.80 1.13 0.96 0.54 0.26 0.56 0.30 0.38 0.61 0.50 0.77 0.30 0.19 0.28 0.28 0.19 0.46 0.41 0.24 0.88 0.19 0.36 0.37 0.27 0.53 0.75 0.43 0.69 0.21 0.28 0.24 0.18 0.40 0.35 0.36 0.47 0.87 0.63 0.77 0.69 0.58 0.92 0.77 0.86 0.45 0.72 0.62 0.39 0.87 0.75 0.77 0.10 0.28 0.13 0.28 0.29 0.11 0.30 N/a 5.19 3.57 3.90 3.60 3.30 4.83 6.07 5.28 5.47 2.87 3.22 2.93 2.25 3.65 5.03 5.23 1.93 1.07 0.90 1.53 1.05 1.68 1.66 1.57 2.09 0.43 1.66 1.50 0.84 1.86 1.77 1.57 1.88 1.27 1.34 1.28 1.10 1.65 1.40 1.57 1.18 0.73 N/a 0.75 0.68 0.90 0.97 0.97 0.61 1.38 0.53 0.69 0.56 0.65 0.93 0.90 0.56 1.11 0.80 0.86 0.77 0.69 0.90 0.90 1.31 0.72 0.76 0.87 0.55 0.84 1.36 0.88 Prices of most common presentation, in €, 2002 Parallel trade in the EU z Regional exhaustion of rights z Considerable jurisprudence by the ECJ z Significant uptake: 1998 – 2002 z Actively encouraged by some member-states 1 Incentives encouraging the use of PI medicines in Europe Market share of parallel imports, 1997-2002 PI penetration 0,45 0,4 z 0,35 z 0,3 0,25 z 0,2 0,15 z 0,1 0,05 Europe Germany 20 02 20 02 20 01 20 00 20 01 19 99 UK 20 00 19 99 19 98 19 98 19 97 19 97 0 Netherlands z z United Kingdom 1. Discounts to pharmacy 2. Clawback Germany 1. Quota to pharmacies for PI dispensing 2. Penalties for not adhering to quota Denmark 1. Information on PI use 2. Mandatory substitution 1. 2. 3. Quantify economic impact of parallel trade in six major destination countries Focus on 6 widely used product classes* accounting for 22% of branded retail market (15-28% depending on country); account for some of the most highly PT products Apportion static benefits to individual stakeholders Research Endpoints 1. 2. 3. Examine direct effects, arising from price differences between locally sourced and PI drugs (list prices and discounts) Competition effects in destination countries and price convergence Competition effects across countries – does arbitrage work? * Statins, ACE I and ACE II inhibitors, PPIs, SSRIs, and Atypical antipsychotics z z z The Netherlands 1. 1/3 of price difference accrues to pharmacy 2. Clawback encouraging pharmacies to procure more cost-effectively Sweden 1. Information and PI substitution 2. Aggregate payment to pharmacy for work on generics and PI drugs Market shares of PI products, 2002 Research agenda and endpoints The Research Agenda z Atorvastatin Pravastatin Simvastatin Captopril Enalapril Quinalapril Ramipril Losartan Valsartan Clozapine Olanzapine Risperidone Lansoprazole Omeprazole Pantoprazole Citalopram Fluoxetine Paroxetine Sertraline Norway Germany Sweden Denmark UK Netherlands 2% 14% 36% 3% 24% 0% 0% 0% 0% 58% 11% 42% 0% 4% 0% 6% 1% 9% 0% 0% 17% 19% 0% 0% 19% 0% 18% 0% 0% 74% 24% 32% 0% 16% 0% 21% 20% 47% 8% 5% 0% 56% 7% 5% 39% 19% 0% 0% 13% 0% 25% 0% 0% 0% 19% 17% 43% 25% 54% 38% 12% 7% 51% 0% 1% 17% 21% 0% 20% 10% 8% 33% 14% 11% 18% 15% 34% 6% 14% 1% 10% 1% 0% 8% 3% 0% 5% 0% 63% 62% 42% 0% 6% 17% 5% 19% 9% 65% 2% 4% 8% 0% 72% 23% 0% 47% 45% 31% 19% 32% 25% 10% 18% 23% Allocation of benefits (1) Country A. Direct effects Norway 1. Health Insurance 2. Pharmacy 3. Patients 4. Parallel importers 5. Industry Germany Cost-sharing policy Impact on Pharmacy % of patients benefits, 2002 market Co-insurance (0%,12%,30% with cap per script) Marginal €563,000 0.3% Pack-related 0 Marginal 0 0 0 0 0 0 Sweden Deductible plus co-insurance up to a limit Denmark Deductible plus co-insurance up to limit Marginal Flat fee 0 invisible ? No co-pays 0 € 6,382,000 1.2% UK Netherlands 2 Costs of parallel importers in destination countries Allocation of benefits (2) Benefits to Parallel Traders (PT), 2002 (2) Savings to health insurance, 2002 (1) Country Ratio of (2)/(1) € % of market € % mark up Country Cost of obtaining marketing authorisation Denmark Annual fee of DKK 7,950 (€1,071) plus application fee of DKK15,095 (€2,033.4) or renewal fee of DKK13,975 (€1,882.5) Germany €1,380 € 563,000 0.3% € 12,447,000 46% 22.7 Germany € 17,730,000 0.8% € 97,965,000 53% 5.5 Sweden € 3,770,000 1.3% € 18,453,000 60% 4.9 Denmark € 3,002,000 2.2% €7,371,200 44% 2.5 Sweden UK €55,887,000 2.8% € 469,013,000 49% 8.4 UK Netherlands €19,119,000 3.6% € 43,199,000 44% 2.3 Norway Total impact €100,071,000 1.8% € 648,449 ,000 53% 6.5 Norway The Netherlands €1,021 per year SEK15,000 (€1,637) £1,465 (€2,125) NOK 70,000 – 80,000 (€8,489 - €9,701.8) plus control fee of 0.7% of the turnover of the MA holder Distribution of benefits: comparative presentation by stakeholder (3) 500000 18453 400000 600000 B. Competition effects in destination countries 12447 300000 Pharmacy 7371 563 563 200000 Insurance 0 3770 Norway 100000 0 Sweden 40692 5902 18798 0 3 ,0 0 2 1 7 70 2 0 Netherlands Denmark 97965 Germany 469450 0 55887 UK 0 5000 Importers 10000 Insurance 15000 Pharmacy 20000 250 Importers Competition effects within countries- Germany 0.96 5.4 0.94 5.2 0.92 0.9 0.88 0.86 1.4 1.2 5 1 4.8 0.8 4.6 0.6 4.4 0.4 4.2 0.84 0.2 4 1997 1998 1999 2000 Simvastatin 2001 2002 0 1997 Simvastatin PI 1.7 1.65 1998 1999 2000 Olanzapine 2001 2002 6 1.2 5 1.55 0.8 1.5 0.6 1.45 0.4 1.4 0.2 1997 1998 1999 Lanzoprazole 2000 2001 2002 Lanzoprazole PI 1999 2000 2001 2002 Fluoxetine PI C. Competition effects across countries 4 3 2 1 0 1.35 1998 Fluoxetine 1.4 1 1.6 1997 Olanzapine PI 0 1997 1998 1999 Paroxetine 2000 2001 2002 Paroxetine PI 1997 1998 1999 Risperidone 2000 2001 2002 Risperidone PI 3 Price convergence with lowest price country, 1997 - 2002 Atorvastatin Pravastatin Simvastatin Captopril Enalapril Quinapril Ramipril Clozapine Olanzapine Risperidone NOR X X X X X N/A 0 0 X 9 GER X 0 X 9 0 9 0 9 X 0 SWE X 9 0 0 X 9 0 9 0 9 DEN 9 0 0 X 0 9 0 X 0 0 UK X 0 0 X X 9 0 X 0 0 NL X X 9 0 0 9 9 X 9 X Impact on industry z z z z ¾ Pharmaceutical manufacturers incur a significant loss of business in destination countries from the conduct of parallel trade. ¾ The conduct of parallel trade reduces manufacturers’ overall profitability (loss of producer surplus), without necessarily increasing societal welfare. ¾ Reduced overall profitability may lead to downsizing in source countries over the medium term. ¾ Threatens European industry competitiveness Concluding remarks – the European experience z z z z z z z Modest savings to health insurance organisations through direct (price) effects Zero or, at best, marginal benefits to patients Little evidence of intra- or inter-country competition effects and price convergence Some benefits to pharmacies Most pecuniary benefits accrue to parallel distributors and the overall distribution chain Transfer from industry (producer) surplus mostly to the distribution chain and less so to health insurance and patients Evidence of product shortages in source countries Concluding remarks Lessons for the USA z 1. Safety concerns z 2. Exhaustion of rights z 3. Savings to stakeholders Insurance Patients z Wholesalers z z z 4. Supply issue z 5. Competition and Pricing 4
