Box 1.1. Why Has South Africa’s Recovery
advertisement
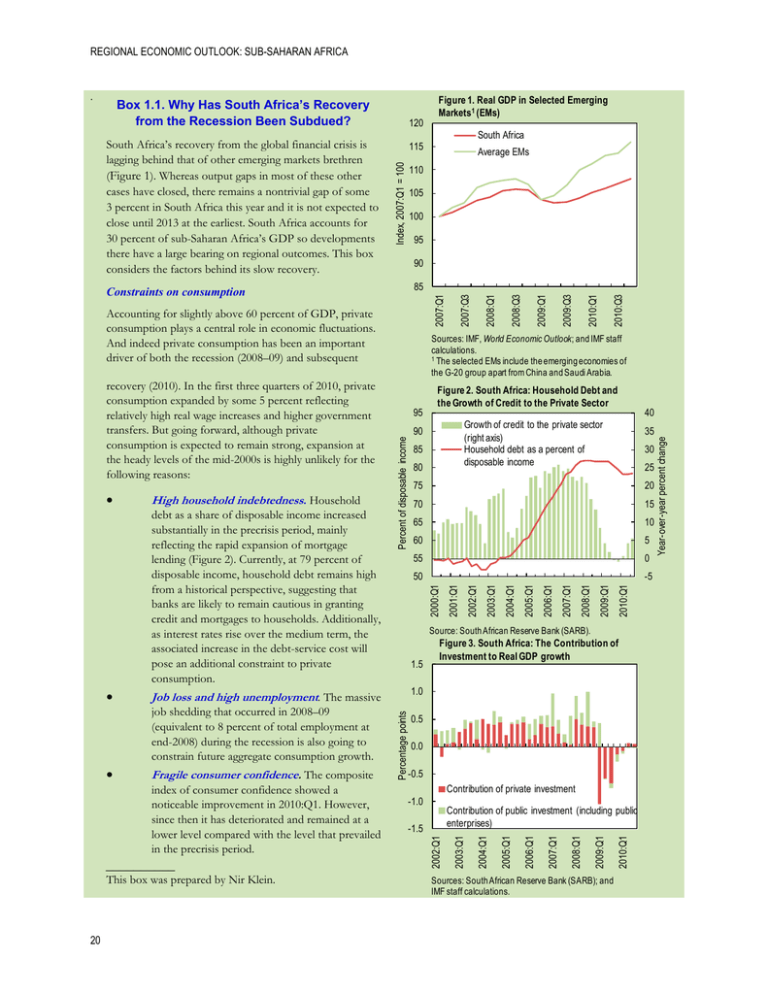
REGIONAL ECONOMIC OUTLOOK: SUB-SAHARAN AFRICA Box 1.1. Why Has South Africa’s Recovery from the Recession Been Subdued? 105 100 95 90 This box was prepared by Nir Klein. 20 2010:Q1 2009:Q3 2009:Q1 2008:Q3 2008:Q1 2007:Q1 2010:Q3 25 15 65 10 60 5 2010:Q1 2009:Q1 2008:Q1 2007:Q1 2006:Q1 2005:Q1 2004:Q1 2003:Q1 -5 2002:Q1 0 50 2001:Q1 55 Figure 3. South Africa: The Contribution of Investment to Real GDP growth 1.0 0.5 0.0 -0.5 Contribution of private investment -1.0 Sources: South African Reserve Bank (SARB); and IMF staff calculations. 2010:Q1 2009:Q1 2008:Q1 2007:Q1 Contribution of public investment (including public enterprises) -1.5 Year-over-year percent change 30 70 2006:Q1 __________ 35 20 2005:Q1 index of consumer confidence showed a noticeable improvement in 2010:Q1. However, since then it has deteriorated and remained at a lower level compared with the level that prevailed in the precrisis period. 40 75 2004:Q1 Fragile consumer confidence. The composite 80 2003:Q1 x 85 1.5 Job loss and high unemployment. The massive job shedding that occurred in 2008–09 (equivalent to 8 percent of total employment at end-2008) during the recession is also going to constrain future aggregate consumption growth. Growth of credit to the private sector (right axis) Household debt as a percent of disposable income 90 Source: South African Reserve Bank (SARB). Percentage points x 95 Figure 2. South Africa: Household Debt and the Growth of Credit to the Private Sector 2000:Q1 debt as a share of disposable income increased substantially in the precrisis period, mainly reflecting the rapid expansion of mortgage lending (Figure 2). Currently, at 79 percent of disposable income, household debt remains high from a historical perspective, suggesting that banks are likely to remain cautious in granting credit and mortgages to households. Additionally, as interest rates rise over the medium term, the associated increase in the debt-service cost will pose an additional constraint to private consumption. Sources: IMF, World Economic Outlook; and IMF staff calculations. 1 The selected EMs include the emerging economies of the G-20 group apart from China and Saudi Arabia. Percent of disposable income High household indebtedness. Household 2007:Q3 85 Accounting for slightly above 60 percent of GDP, private consumption plays a central role in economic fluctuations. And indeed private consumption has been an important driver of both the recession (2008–09) and subsequent x Average EMs 110 Constraints on consumption recovery (2010). In the first three quarters of 2010, private consumption expanded by some 5 percent reflecting relatively high real wage increases and higher government transfers. But going forward, although private consumption is expected to remain strong, expansion at the heady levels of the mid-2000s is highly unlikely for the following reasons: South Africa 115 Index, 2007:Q1 = 100 South Africa’s recovery from the global financial crisis is lagging behind that of other emerging markets brethren (Figure 1). Whereas output gaps in most of these other cases have closed, there remains a nontrivial gap of some 3 percent in South Africa this year and it is not expected to close until 2013 at the earliest. South Africa accounts for 30 percent of sub-Saharan Africa’s GDP so developments there have a large bearing on regional outcomes. This box considers the factors behind its slow recovery. 120 Figure 1. Real GDP in Selected Emerging Markets1 (EMs) 2002:Q1 . 1. RECOVERY AND NEW RISKS Sluggish recovery in private investment 84 20 Change in inventories -40 Utilization rate in the manufacturing sector (right axis) 74 2010:Q1 2009:Q1 2008:Q1 2007:Q1 2006:Q1 2005:Q1 2004:Q1 2003:Q1 2002:Q1 72 Source: South African Reserve Bank (SARB). 40 35 Figure 5. South Africa: Change in the Share of Total Exports of Goods The share in 2008:Q2 The share in 2010:Q3 30 25 20 15 10 5 0 To To the To Asia To Africa Other Europe Americas Regions Source: South African Reserve Bank (SARB). 130 Figure 6. Real Effective Exchange Rate in South Africa and Selected EMs 120 110 100 90 80 Brazil South Africa Poland 70 60 Mexico Turkey 2010:Q4 2010:Q3 2010:Q2 2010:Q1 2009:Q4 2009:Q3 2009:Q2 50 2009:Q1 received substantial amounts of portfolio inflows. With measured intervention by the South Africa Reserve Bank (SARB), these inflows have put upward pressures on the real effective exchange rate (REER), which has appreciated since early-2008 by about 25 percent—significantly more than other emerging markets (Figure 6). Percent 76 2008:Q4 Loss of competitiveness. South Africa has 78 -20 2008:Q3 x 80 2008:Q2 Africa’s exports fell sharply at the outset of the financial crisis, external demand has picked up recently, and exports to some destinations returned to their precrisis level. To Europe, however, exports remain weak, reflecting the weak recovery in the euro area and the sharp appreciation of the rand against the euro (around 30 percent since end-2008). The latter shows in the decline of Europe’s share to 26 percent in total exports of goods from 34 percent on the eve of the crisis (Figure 5). All in all, the fact that Europe remains South Africa’s second-largest trading partner combine d with Europe’s modest growth trajectory in the foreseeable future limits the prospects for stronger external demand for South African products. 82 0 Percent of total exports of goods Weak demand from Europe. Although South 86 -60 Index, 2008:Q1 = 100 x 88 40 Weak external demand, exacerbated by deterioration of external competitiveness In part, the weak GDP growth reflects weak external demand for South Africa’s goods and services. Although South Africa’s terms of trade have improved by 18 percent since end-2008, exports remained below their precrisis level. This reflects various factors, including Figure 4. South Africa: Change in Inventory and Capacity Utilization Rate 2008:Q1 The lack of recovery in private investment may reflect several factors, including firms’ anticipation that weak demand conditions will prevail. This perception is supported by moderate business confidence, which, although improved in recent months, remains well below that observed in the precrisis period. The latter translates to low capacity use in the manufacturing sector and to firms’ decision to run down their existing stocks instead of building new inventories (Figure 4). 60 Billions of 2005 rand The global financial crisis triggered a noticeable decline in the level of investment, mainly from the private sector. Since end-2008, private investment has declined by about 2 percentage points of GDP, partly offset by the increase in public investment. And despite the recovery, the contribution of private investment to real GDP growth in 2010 was negligible (Figure 3). Sources: IMF, Statistics Department INS database; and IMF staff calculations. 21
