Document 11443918
advertisement
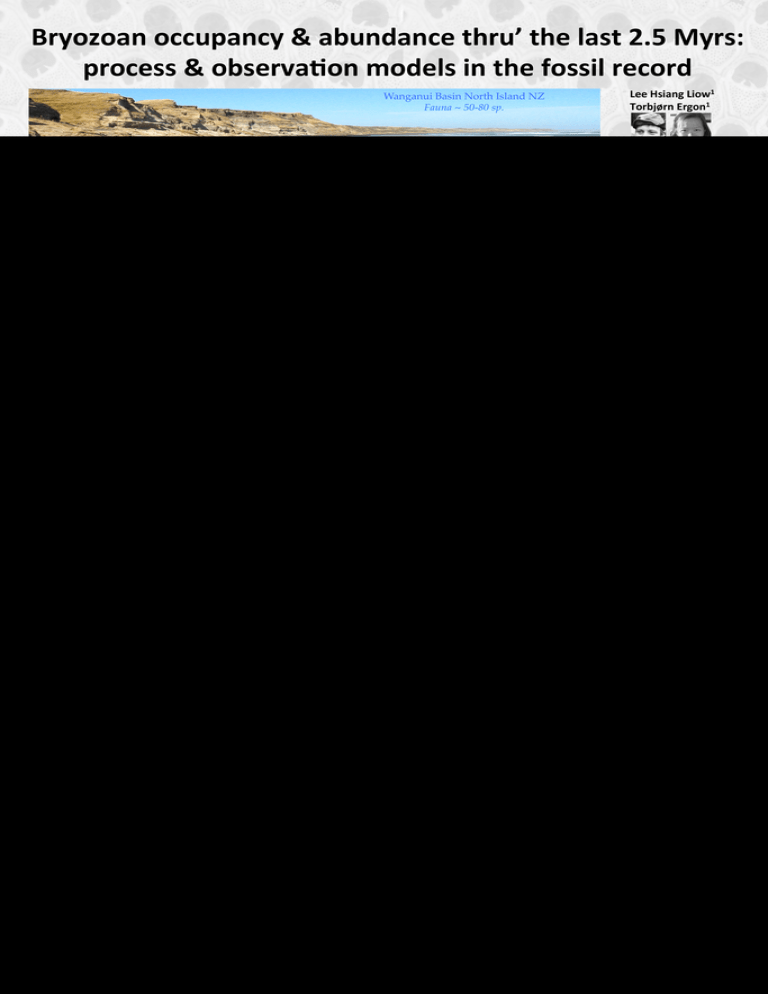
Bryozoan occupancy & abundance thru’ the last 2.5 Myrs: process & observa;on models in the fossil record Lee Hsiang Liow1 Torbjørn Ergon1 Wanganui Basin North Island NZ! Fauna ~ 50-80 sp.! 1Centre for Ecological and Evolu;onary Synthesis • The probability of recording a fossilized species depends on past abundance and on University of Oslo, Norway preserva;on probability, both of which may vary greatly over ;me and space. • We develop a mul;-­‐species occupancy model where the probability of detec;on, given occupancy, is factorized into a preserva;on component common to all encrus;ng bryozoan species, and a species-­‐specific component related to abundance. Species Data Indices Number of shells with species s at site I y[i,s] Number of shells sampled at site I N[i] Site i Forma;on(;me) t Species s S1 Antarctothoa tongima Model in BUGS pseudo-­‐code Parameters Occupancy state z[i,s]~dbern(psi[t[i],s]) Occupancy probability (forma;on and species specific) psi[t[i],s] Coloniza;on rate lambda[i,s]~dlnorm(mu.lambda[s,t[i],s], tau.lambda[s]) Coloniza;on probability r[i,s]=1-exp(-lambda[i,s]) Mean of log coloniza;on rate (∝ abundance) among sites within forma;ons mu.lambda[t,s] 1/Variance of log coloniza;on rate among sites S2 Escharoides excavata Effec;ve detec;on probability eff.p[i,s]=z[i,s]*q[t[i]]*r[i,s] tau.lambda[s] Preserva;on probability (forma;on specific) q[t] FORMATION = “Time” (Nt = 9) SITE (Ni = 120) REPLICATES Nj[i] > 30 Shell 30 S3 Arachnopusia unicornis O Isotope stage Ni years (106) OIS 9 2 0.3 OIS 11 13 OIS 12 6 0.4 OIS 13 10 OIS 14 13 0.5 OIS 16 12 0.6 OIS 24 5 0.9 OIS 61 1.7 (base) OIS 77-­‐73 21 OIS71-­‐67 38 2.46 (base) Psi Occupancy probability A.tongima E.excavata E.excavata A.tongima • By borrowing informa;on from other s pecies with similar preserva;on proper;es we are able to es;mate species specific distribu;ons of past rela;ve abundance. Simula;ons: SIMULATIONS Posterior probability distribu;ons as violin plots. Only those with less than 40% overlap with prior distribu;ons are shown. • Accurate es;mates of median coloniza;on rate distribu;ons with only 2 species, but more species may be needed when occupancy, median abundances and/or preserva;on are lower. Super-­‐sp. A. unicornis Super-­‐sp. mu.lambda Median log coloniza;on rate SPECIES s 1 forma;on with 1000 itera;ons of each scenario where 1,2,4,8,16,32 and 64 species were used. All species have the same parameters (true value shown with horizontal lines). Only 1 species from each scenario shown. A. unicornis SD log sqrt(1/tau.lambda) coloniza;on rate q Preserva;on probability PROSPECTS & PLANS • • • • • Include more species Add shell level informa;on e.g. size, species, condi;on More simula;ons (lower occupancy, median abundance, preserva;on) Explore covariates of abundance (e.g. morphological evolu;on, sea level changes, temperatures changes) Explore covariates of preserva;on (e.g. sea level change) Acknowledgements Field work and idenfica;ons: Paul D. Taylor (NHM, London), Seabourne Rust (NZ), Dennis Gordon (NIWA, NZ), Kje;l Voje (CEES, U of Oslo)
