Moonunit Prescribed Fire March 15 & 18, 2004 Tahoe National Forest
advertisement
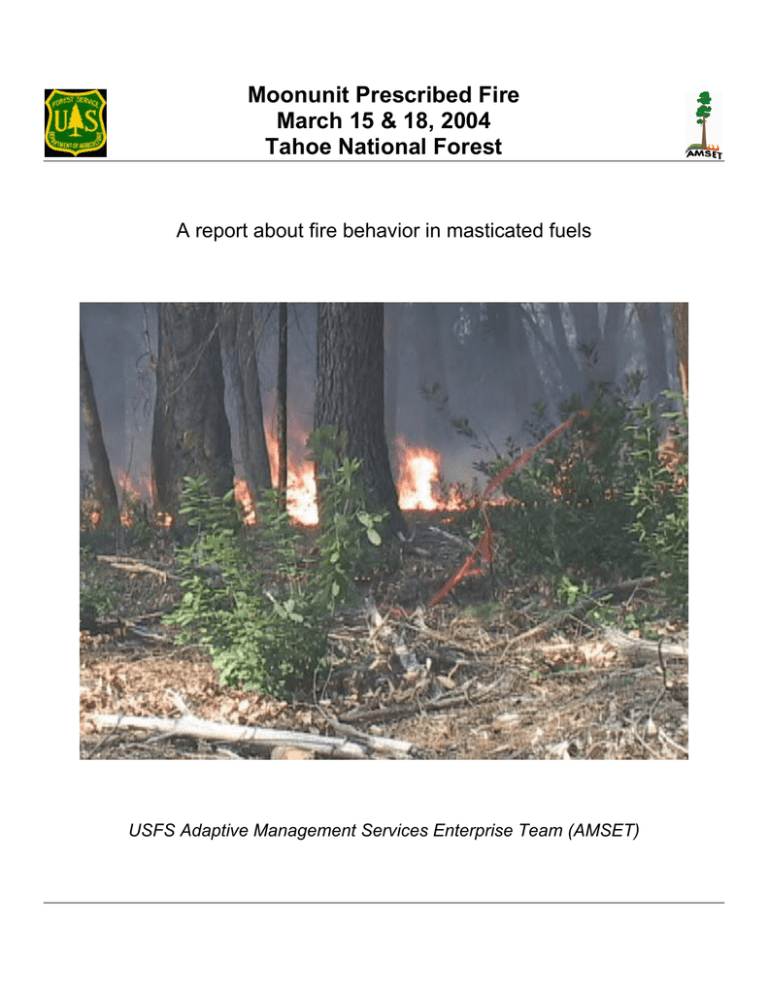
Moonunit Prescribed Fire March 15 & 18, 2004 Tahoe National Forest A report about fire behavior in masticated fuels USFS Adaptive Management Services Enterprise Team (AMSET) Project Two units were burned on March 15, 2004 and March 18, 2004 that composed the Moonunit Prescribed Burn on the Tahoe National Forest (Figures 1 and 2). These units are part of the North Yuba Fire Safe Council Demonstration Area. Both units were masticated 2-3 years previously and are within the mixed conifer zone between 2200-2360 feet (670 – 720 meters) elevation. The approximate location of the burn was west of the Camptonville Ranger District office of the Tahoe National Forest, adjacent to Bullard’s Bar Reservoir (Figure 2). The Adaptive Management Services Enterprise Team (AMSET) set up fire behavior equipment, in these two units, to monitor the fire behavior in masticated fuels. This included four sets of four thermocouples each plot to record temperature, two heat flux sensors to measure radiant heat and total heat flux, and two video cameras to record on-coming fire behavior. In addition, pre-fire data such as downed fuels, litter, duff, fuel depth, slope, aspect, and location were collected the previous week prior to the burns. Figure 1 – General location of project Figure 2 – Project Area Fuels and Weather The first unit (20 acres) consisted of thinned and masticated tanoak (Lithocarpus densiflorus) and mixed conifer downed fuels (Figure 3). In some locations, ponderosa pine (Pinus ponderosa) needles with depths of 4 inches were draped over the masticated tanoak fuels. Tanoak sprouts were prevalent in the unit. The overstory was composed of an equal proportion of mixed conifer species such as Douglas-fir (Pseudotsuga menziesii), ponderosa pine (Pinus ponderosa), incense cedar (Calocedrus decurrens), and sugar pine (Pinus lambertiana) with madrone (Arbutus menziesii) and black oak (Quercus kelloggii). The top of the litter layer was dry with wet duff underneath, remnant from winter precipitation. The second unit (27 acres) was mostly white leaf manzanita (Arctostaphylos viscida) masticated fuels with an overstory of predominantly ponderosa pine and incense cedar (Figure 4). 2 Before the treatment, this stand was composed of primarily 10-12 feet white leaf manzanita, which inhibited the growth of the younger poles and small trees within this stand. Fuel loading for both stands is represented in Table 1. Six Brown planar intercepts were collected at the 20-acre unit. Two Brown planar intercepts were collected at the 27-acre unit. Unit size 20-acre 27-acre Fuel Loading for the Moonunit Prescribed Burn (Tons per Acre) 1-hour 10-hour 100-hour 1000-hour Litter Duff Total w/o duff Fuel depth (inches) 0.75 6.20 5.53 3.42 6.26 65.57 22.16 8.90 1.12 6.58 14.45 3.76 9.47 43.77 35.38 8.35 Table 1. Surface and ground fuels from the Moonunit Prescribed Burn in tons per acre. Date 3/10/04 3/11/04 3/12/04 3/13/04 3/14/04 3/15/04 3/15/04 3/16/04 3/17/04 3/18/04 Weather and Wind Observations for the Moonunit Prescribed Burns Temp Rel. 20' Wind Time Elev (ft) 10 hr Fuel Stick (F) Humidity Wind Dir Spd 14:30 2300 78 24% NE/SE 2-3 11 12:30 2300 73 28% SW 0-2 8 12:45 2300 75 24% NW 0-2 8.5 12:00 2300 73 30% S/SW 0-4 8 12:20 2300 75 37% NW 0-2 8.25 9:15 2300 64 49% N 0-1 8 16:00 2300 77 32% NWS 0-2 N/A 12:00 2300 79 25% NW 0-2 8 12:00 2300 79 30% CALM CALM 8 8:00 2300 55 61% N 0-2 9 Table 2. Weather and wind data taken onsite. Both units were exposed to a high pressure weather system that resided over much of the Pacific Northwest for the previous 1 1/2 weeks. During this time, northern, northwestern, and northeastern winds exposed fuels to lower relative humidity (RH) values than normal for mid-March. On March 15th, the 20-acre unit was burned with relative humidity ranging from 25-32 percent and temperatures averaging in the mid-70°F’s. Winds continued to be from the north and northwest. 3 Figure 3. Pre and post photos from the 20-acre unit of the Moonunit Prescribed Burn. On March 18th, the 27-acre unit was burned with relative humidity ranging from 25-55 and temperatures ranging from 55-72°F. Winds ranged from 0-5 miles per hour (mph), mainly from the southwest, with gusts in the afternoon of 10 mph. Ten-hour fuel moistures reported from the unit during the prescribed burn ranged from 7-9 percent. Figure 4. Pre and post burn fuels. Fire Behavior The 20 acre unit was ignited at 11:00 am on March 15, 2004. The test burn was ignited on the northeast portion of the unit, adjacent to the main road. The tanoak sprouts were consumed and facilitated the burn rather than inhibiting fire intensity and rate of spread (ROS). The fire burned better than expected, with faster rates of spread in the middle of the unit. A small ridge seemed to influence wind. Winds were described at times as “squirrelly” with fire whirls at the most active portion of the fire front. Initially, the fire was ignited by fire personnel. After 30 minutes, it was able to 4 burn on its own without assistance. Ignition specialists on the northern end helped bring the flanks in line with the head of the fire. Rate of spread of approximately 4-8 chains per hour (ch/hr) was measured by Rick Cowell, Tahoe Hotshot Superintendent and burn boss. Flame length at the fire front averaged 3-7 feet, while spotting at the flaming front occurred 5-12 feet ahead of the fire. As the fire neared the upper limits of the prescription, the decision was to cool it down and restart with a modified ignition pattern. At approximately 1:00 – 2:00 pm, a hose lay was established and used to extinguish the fire. The location of the hose lay was within the burn unit, before plots 1-3, and extended from the road to the other end of the unit running north-south. The fire was ignited again on the northern side and spread down slope in a southwesterly direction toward the fire behavior plots. At times, the flame lengths exceeded 10 feet at the flaming front, but averaged 3-5 feet. On the flanks, flame lengths averaged 2-4 feet. Char height along the boles of the trees exceeded maximum flame height for the ponderosa pine and incense cedar. Data loggers recorded rate of spread of approximately 2.7 ch/hr or 2.98 feet per minute. However, this rate of spread was measured after the fire was ignited again, whereas the burn boss measured rate of spread at the most active part of the fire during the initial burn. The prescribed burn continued to burn down slope with some help from ignition specialists after 4:00 pm. Figure 5. Fire behavior in the 20-acre unit of the Moonunit Prescribed burn. Strips approximately 20 feet apart were laid across the remaining unit until the unit was completed at approximately 6:00 pm. The highest temperature recorded from the data logger was 986°C (1806°F), which lasted less than 2 minutes. Temperature dropped to less than 700°C (1292°F) within 3 minutes and stayed at 300°C (572°F) for approximately 6 minutes. The other set of fire behavior equipment did not exceed 720° C (1328°F) and dropped at a faster rate. Radiant and total heat flux followed similar patterns with a maximum total heat flux of 46.92 kilowatts per meter (kW/m2) or 248 Btu/ft2/min at 3:11 pm, while radiant heat reached a maximum of 19.78 kW/m2 (104 Btu/ft2/min) at the same time (Table 3). 5 Summary of Fire Behavior Unit size 20-acre 27-acre max total heat max radiant average flame length max temperature flux heat 3-7 ft 986 ºC 248 Btu/ft2/min 104 Btu/ft2/min 1-3 ft 1101 ºC 136 Btu/ft2/min 114 Btu/ft2/min ROS 4-8 ch/hr negligible Table 3. Summary of fire behavior from the Moonunit Prescribed Burn. 1536:27 1535:15 1532:51 1531:39 1530:27 1528:3 1529:15 1526:51 1525:39 1524:27 1522:3 1523:15 1520:51 1519:39 1518:27 1517:15 1516:3 1514:51 1513:39 1512:27 1511:15 1534:3 TC_1 TC_2 TC_3 TC_4 1100 1000 900 800 700 600 500 400 300 200 100 0 1510:03 Temp (C) Temperature from the 20-acre unit Moonunit Prescribed Burn time (hhmm:ss) Figure 6. Temperature recorded from 4 thermocouples (TC) in masticated tanoak/mixed conifer fuels from the 20-acre Moonunit Prescribed Burn. The 27 acre unit was ignited at 10:20 am on March 18, 2004, in the northeast corner of the unit, approximately 100 yards from the fire behavior equipment. This unit was located east of the 20acre unit. Strip firing techniques were used to facilitate the burn by providing ignition without excessive heat. Ignition specialists planned ignition patterns that cooperated with prevailing winds and topography to ensure a safe and controlled prescribed burn. Small poles, approximately 4-10 inches in diameter, were evenly spaced within the northern/eastern portion of the unit. The masticated fuels were removed one meter around the base of these trees. Many of the trees were treated with foam as the fire front moved through the plot to decrease their potential mortality. 6 Figure 7. Fire behavior in the 27-acre unit of the Moonunit Prescribed Fire. After it was observed that the fire was burning within prescription, the southwestern portion of the unit was ignited separately from the initial ignition site. Slow rates of spread were well within prescription. Unlike the 20-acre burn, this fire was facilitated with ignitions throughout the entire length of the prescribed burn. The backing fire spread slower in the masticated manzanita fuels and faster through the ponderosa pine needles. The fire behavior equipment was placed in the masticated manzanita fuels with very little overstory. Data loggers recorded a maximum temperature of 1011° C (1851° F). The uphill unit recorded temperature exceeding 600° C (1112° F) for 5 minutes and temperature exceeding 300° C (572° F) for 20 minutes. The downhill unit exceeded 600° C (1112° F) for 2 1/2 minutes and temperature exceeded 300° C (572° F) for 15 minutes. Radiant and total heat flux followed similar patterns with a maximum total heat flux of 25.83 Kw/m2 (136 Btu/ft2/min) at 12:42 pm, while radiant heat reached a maximum of 21.53 kW/m2 (114 Btu/ft2/min) at the same time (Table 3, Figure 8). Rate of spread between data loggers was negligible due to the strip firing technique used between these two locations. Moonunit RxBurn 27-acre unit 1100 1000 900 800 700 600 500 400 300 200 100 0 TC_1 TC_2 TC_3 1316:3 1313:14 1310:25 1307:36 1304:47 1301:58 1259:9 1256:20 1253:31 1250:42 1245:4 1247:53 1242:15 1239:26 1236:37 1233:48 1230:59 1228:10 1225:21 Temp (C) TC_4 Time (hhmm:ss) Figure 8. Temperature as shown by 4 thermocouple readings (TC). 7
