Measurements Of The Lateral Distribution Of Heavy Vehicles And Its... The Design Of Road Pavements
advertisement

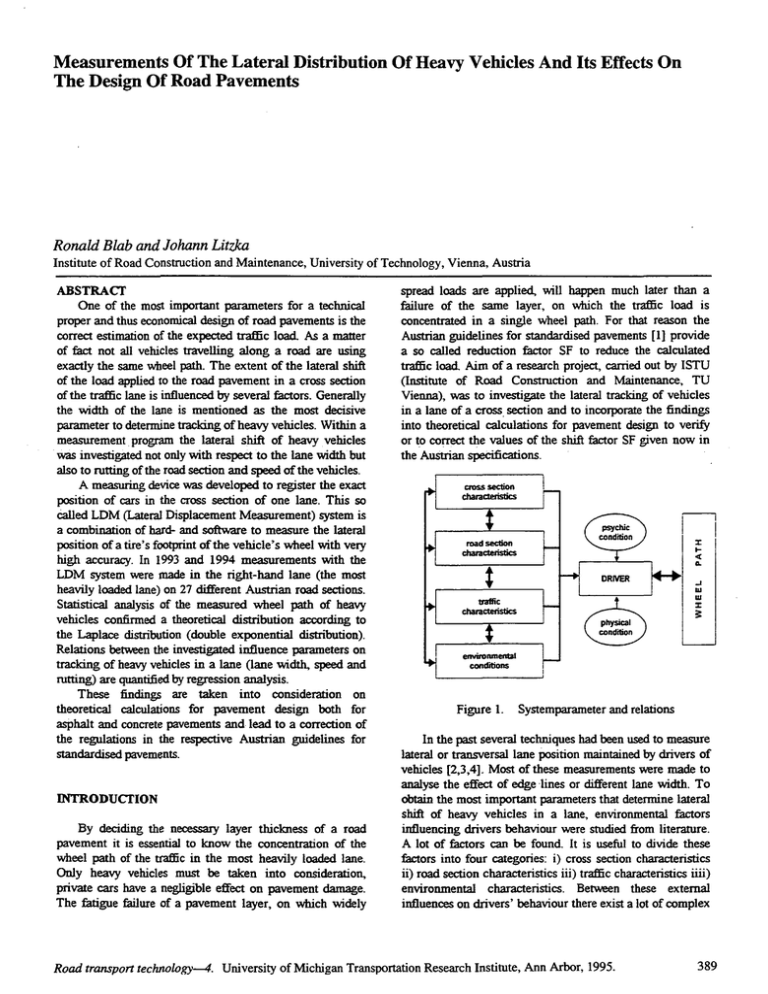
Measurements Of The Lateral Distribution Of Heavy Vehicles And Its Effects On The Design Of Road Pavements Ronald Blab and Johann LitzJw. Institute of Road Construction and Maintenance, University of Technology, Vienna, Austria ABSTRACf One of the most important parameters for a technical proper and thus economical design of road pavements is the correct estimation of the expected traffic load. As a matter of fact not all vehicles travelling along a road are using exactly the same wheel path. The extent of the lateral shift of the load applied to the road pavement in a cross section of the traffic lane is influenced by several factors. Generally the width of the lane is mentioned as the most decisive parameter to determine tracking of heavy vehicles. Within a measurement program the lateral shift of heavy vehicles was investigated not only with respect to the lane width but also to rutting of the road section and speed of the vehicles. A measuring device was developed to register the exact position of cars in the cross section of one lane. This so Called LDM (Lateral Displacement Measurement) system is a combination of hard- and software to measure the lateral position ofa tire's footprint of the vehicle's wheel with very high accuracy. In 1993 and 1994 measurements with the LDM system were made in the right-hand lane (the most heavily loaded lane) on 27 different Austrian road sections. Statistical analysis of the measured wheel path of heavy vehicles confirmed a theoretical distribution according to the Laplace distribution (double exponential distribution). Relations between the investigated influence parameters on tracking of heavy vehicles in a lane (lane width. speed and rutting) are quantified by regression analysis. These findings are taken into consideration on theoretical calculations for pavement design both for asphalt and concrete pavements and lead to a correction of the regulations in the respective Austrian guidelines for standardised pavements. INTRODUCfION By deciding the necessary layer thickness of a road pavement it is essential to know the concentration of the wheel path of the traffic in the most heavily loaded lane. Only heavy vehicles must be taken into consideration, private cars have a negligible effect on pavement damage. The fatigue failure of a pavement layer, on which widely spread loads are applied, will happen much later than a failure of the same layer, on which the traffic load is concentrated in a single wheel path. For that reason the Austrian guidelines for standardised pavements [1] provide a so called reduction factor SF to reduce the calculated traffic load. Aim of a research project, carried out by ISTU (Institute of Road Construction and Maintenance, TU Vienna), was to investigate the lateral tracking of vehicles in a lane of a cross. section and to incorporate the findings into theoretical calculations for pavement design to verify or to correct the values of the shift factor SF given now in the Austrian specifications. n J: Ioe( CL Figure 1. Systemparameter and relations In the past several techniques had been used to measure lateral or transversal lane position maintained by drivers of vehicles [2,3,4]. Most of these measurements were made to analyse the effect of edge lines or different lane width. To obtain the most important parameters that detennine lateral shift of heavy vehicles in a lane, environmental factors influencing drivers behaviour were studied from literature. A lot of factors can be found. It is useful to divide these factors into four categories: i) cross section characteristics ii) road section characteristics iii) traffic characteristics iiii) environmental characteristics. Between these external influences on drivers' behaviour there exist a lot of complex Road transport technology--4. University of Micbigan Transportation Research Institute, Ann Arbor, 1995. 389 ROAD TRANSPORT TECHNOLOGY--4 interactions that lead to the chosen lane position and speed (Figure 1). It is not possible to quantify all these parameters pointed out in their influence on the maintained wheel path. Four factors are considered to be most important: i) lane width ii) vehicle width iii) vehicle speed iiii) rut depth in the cross section. The importance of lane width and vehicle width referring to lateral tracking of vehicles had been determined in several studies, but most of them were made under circumstances that cannot be compared with modem traffic conditions. Canalising effects of rutting and higher speed on the wheel path are well known, but have never been quantified by field measurements so far. LATERAL DISPLACEMENT MEASUREMENT SYSTEM Together with colleagues from TU Delft (Netherlands) who worked on a similar research project years ago [5], a measurement device was developed to register the position and width of a vehicles tires passing a cross section and its speed as well. This so called LDM (Lateral Displacement System) is shown in Figure 2. Figure 2. LDM - System (schematic) It consists of a very thin and flexible rubber mat, fixed on the road surface, a registration unit and a control unit (data processing PC). As a vehicle passes the mat, some switch sensors are pressed by the tires. Thus the footprints of the tires seperatly for each axle and the speed as well is registrated. The switches inside the mat are situated in a central distance of 30 mm, each switch has a width of 15 mm. Vehicle speed is measured by two extra tape switches, which are attached on the road surface right in front the mat. Installation or removal of the mat is very easy and can be done within a few minutes. Because of the flexibility of the mat, it adapts itself very good to the respective road surface even in cross sections with deep ruts. Figure 3 shows an example for the file structure of the LDM file, when a truck with a trailer passes the mat. The LDM file is stored in binary format and consists of a file 390 header (file name, number of records, record length and number of switches), and the bitmaps. For each axle one bitmap is generated with the information of the axle's speed and the status of the switches (,,0" - offand ,,1" - on). In the given example the truck has a single tired front axle and a dual tired rear axle, its trailer is equipped with single tired wheels. A software program separates automatically private cars from heavy vehicles and within the group of heavy vehicles delivery vans are devided from trucks. File : bJ]Oa.biI R _ : 794 _ Time ..... -- -.... 30 t>,<... SwtcIIes: '92 .. Speed Bitme" ..., illtlln'GIDlItltll' 1,1111111:1:11 011111111 lOA IfIl"tI' 1I1t1t11 lOA '1111nll W Figure 3. LDM file structure MEASUREMENT PROGRAM In 1993 and 1994 measurements were made in the right - hand lane (the most heavily loaded lane) of 27 Austrian road sections, three of them heavily trafficked highways with two lanes in each direction. On these 27 sections position and speed of 43,233 axles of heavy vehicles were registrated among them 16,482 dual tired and 26,751 single tired wheels. Altogether binary data files, which contained bitmap data only from axles of heavy vehicles, with a volume of 13.8 MBites had to be analysed. All measurements were made on straight horizontal road sections only during daytime. Lane width differed between 2.75 m and 4.00 m. Before measurements with the LDM system were done, in each cross section transverse unevenness was assessed by a transverse profilometer to determine shape and maximum depth of ruts. The measured maximum rut depth in the investigated road sections was between 0 to 25 mm. DATA ANALYSIS DEFINITIONS AIl. example for a frequency distribution showing the number of switches activated by single tired axles of heavy vehicles on a 3.75 m wide lane during one measurement session, is given in Figure 4. The pattern of switches activated by dual tired axles in the same cross section is shown in Figure 5. Thus "distribution of tire passing" characterises, how often each point of the cross section in the lane is passed by any part of the footprint of a vehicles tire and therefore these frequency distribution is not only GEOMETRY AND OTHER ISSUES ACTIVATED ACTIVATEDS~TCHES 2SOO H·I SINGLE TIRED WHEEL S~TCHES 3XO.-----------------------------------, 3XO,---------------~------------------~ I····· . HHI 2SOO 200J 200J 1500 1500 1CXXl 1CXXl DUAL TIRED WHEEL I 500 o o ~ g @ ~ ~ ~ ~ ~ ~ ~ ~ ~ ~ o o ~ g 8 ~ @~ ~ ~ ~ ~ ~ ~ ~ LANE POSITION [an] LANE POSITION [an] Figure 4. Pattern of single tired wheels Figure 5. Pattern of dual tired wheels NUMBER OF ACTIVATED SWITCHES 3~.-----------------------------------------~ 2500 2~ -------------------- 1500 500 LANE POSITION Figure 6. 3,0 Distribution of tire passing FREQUENCY 1%] r-------------------------------------------, 2,5 2,0 - - - -.- - - - - - - - - - 1,5 1.0 - - - - - - - - - - - - - 0.5 LANE POSITION Figure 7. Distribution of wheel path 391 ROAD TRANSPORT TECHNOLOGY-4 If the distribution of tire width of vehicles. which are passing the respective cross section of a lane. is known. the distribution of tire passing can be derived from the wheel path distribution. Respective mathematical relations are given in [7]. But statistical tests show. that most of the measured distributions of tire passing are described by a normal or Gauss distribution as well. It is very important to recognise. that for introducing lateral loading into pavement design the wheel path distribution (described by the Laplace distribution) and not the distribution of tire passing must be used to simulate lateral shift of the load. if the tire contact pressure applied to the respective pavement is simulated and idealised in the used pavement model by a circular unifonnly - distributed load. dependent on the position of the vehicles passing cross section but also on the width of the tires (Figure 6). To eliminate influence of tire width. the wheel path of a vehicle is defined as the position of the centre of a single or dual tired wheel of a vehicle's axle in the cross section of a lane (Figure 7). It is essential to distinguish between these two defined distributions (..tire passing" and ••wheel path"). a fact that was not taken into account in most of the former investigations. DlSTRIBUI'ION OF WHEEL PATH Statistical tests confirm, that the measured wheel path distribution of heavy vehicles on straight horizontal road sections is well described by the Laplace distribution, which is often known as the double - exponential distribution. (Figure 8). Among other things the Laplace function is used in biology to describe latent periodical mechanisms [6]. Therefore an imaginary .,ideal line" in the lane exists on straight road sections. which is the same for each truck driver. If a trucker deviates too much from this ideal line. he tries to steer for it again. From a biological point of view this ideal line can be interpreted as an unconscious stimulus and the steering for it as reaction on this stimulus. parameter estimator method/properties J.1 Xm maximum likelihood A - L:IXi-Xml n i=1 maximum likelihood 1 D Table 1. Parameter estnnatJon 20.------------------------------------------------ - ~ 15 > (J F.··.... ·,.. ··! measurement ;._._....................... _......................... ············_············_······-'11··_·_······· ...... ·1 - - Gauss 2 w 10 :;) aw a: u- 5 o o N LANE POSI1l0N [an] Figure 8. Theoretical wheel path distribution The probability· density function f(x) of the two parametric Laplace distribution is written as follows: f(x)=_1 exp(Jx-flIJ 21.. A Equ.l where J.1 is a location parameter (- er; < fl < er; ). the mean which characterises the common ideal line of truck drivers in the lane. and A is a scale parameter (A > 0). A simple relation exists between the scale parameter A and the standard deviation er of the Laplace function: Equ.2 From a measured frequency distribution (sample mean x"" sample size n. sample data Xi) the two parameters of the Laplace function can be estimated according to the ,,maximum likelihood" - method by using the estimators given in Table 1. 392 REGRESSION ANALYSIS By means of regression analysis the influence parameters (lane width. rutting. speed) on the extent of lateral wheel path distribution can be quantified. Using the scale parameter A. of each sample, that can be derived from the estimators given in Table 1. to describe the extent of the lateral wheel path in a cross section. the regression functions for different speed levels and rut depth ranges were detennined. Figure 9. 10 and 11 show the results of the regression analysis for rut depth ranges < 10 nun (little rutting). 10 - 15 mm (medium rutting), and > 15 nun (deep rutting). These regression functions indicate. that - if there is no or little rutting. lane width is the main dominant parameter on the extent of the lateral shift of the wheel path. - higher speed leads to a concentration of the wheel paths in a lane. GEOMETRY AND OTHER ISSUES SCALE PARAMETER I.. [10.2 m] 25~------------~------------~--~-, ., 20 mml , IRUT DEPTH < 10 .......................... -..... ~ .........~.......-... -.... --t- .. -....7.~ -~.: ;.r ....·......·. ·. ·....· .. SPEED .......... 15 10 ~ <60kmlh --b- 60 - 80 kmlh -0- 80 - 100 kmlh _........................................................................L.: .......... c............,.....""1....,..._................._...._......................... . ; 5+-------~~---+----~~~--~+-----~ 3,25 3,00 3,50 3,75 4,00 4,25 LAN E WIDTH [m] Figure 9 Correlation between scale parameter A of lateral shift, lane width and speed for a road section with little rutting SCALE PARAMETER I.. [10.2 m] 25~----------~~----~,.~:-------------, IRUT DEPTH 10 ~ 15 mml' 20 SPEED ~ 15 .. --b- -0- <60kmlh 60· - 80 kmIh 80 - 100 kmIh 5+-----~~~~~--~~~~~--~----~ 3,25 3,00 Figure 10' ~75 3,50 LANE WlD I H [m] 4,00 4,25 Correlation between scale parameter A of lateral shift, lane width and speed for a road section with medium rutting SCALE PARAMETER I.. [10.2 m] 25~--------------------------------~ ; ., ~U~O'EPTH>;5 20 -.--.. .-.. ---.-..!-.......c;~~·'--·---f:~-~f· . ".~" . : . 15 _. __... _....... _ ...l ...... _ ... _'-__._ .. .. 10 --'--""--'-- ~." .. l-·. j •. • .• mmlt --·::·0tt7T:+~·-·--··2;[_ ..........---.......... ..... ':. ·::·::~t::::'.·· ·--:~".~·c·-:--r'''- SPEED -: ,":. :f: . ;c...;'''''-;c·--·f---·--·. ·..--:. ·- .. ~ 6O-80kmlh --b- 80 - 100 kmIh .. ," ..... ..: . ,-....--=-.-... ; . 'l" 5~----~~----~--~--~------~----~ 3,50 3,75 4,00 4,25 3,25 3,00 LANE WIDTH [m] Figure 11 Correlation between scale parameter A of lateral shift, lane width and speed for a road section with heavy rutting 393 ROAD TRANSPORT TECHNOLOGY-4 - canalising effects of ruts can be proven even for rut depths between 10 - 15 mm and are obvious for rut depths > 15 mm. Further more an evident relation exists between lane width and speed level of heavy vehicles. Wider lanes invite truckers to go with higher speed and higher speed leads to a concentration of the wheel paths in the lane. EFFECfS ON THE TmCKNESS DESIGN OF PAVEMENTS fatigue damage mechanism of pavement layers is described by Miner's law [9], fatigue damage Cv of transversely distributed loads can be derived from the equation: Equ.4 The fatigue damage C. of loads, which are not transversely distributed, is received by calculating the allowable load repetitions N. of a standard load situated in the centre line (x = 0), applied with a relative frequency ha: C The required thickness of a pavement is dependent on the traffic load., climate, bearing capacity of the subgrade and properties of the pavement materials used. The respective Austrian guidelines for standardised pavements provides requirements for minimum bearing capacity of the subgrade (formation level) and for material properties. Therefore the estimation of the expected traffic load during the design life is most important for a technical proper thickness design. The procedure used in the Austrian design guide to convert a traffic stream of different axle loads into a design traffic number is to calculate an equivalent number of 100 kN single axle loads (design load) using load equivalency factors based on the well known "Fourth Power Law". But lateral shifts of the wheel path in the cross section of a lane cause a distribution of the traffic load applied to the road pavement and therefore the calculated design load can be reduced. S =~ N Equ.5.1 s where Equ.5.2 x THEORETICAL \/\.HEEL PATH DISTRIBUTION hex) PAVEMENT MODEL DEFINITION OF A SHIFT F ACfOR To take into consideration the lateral distribution of the design load a reduction factor is defined, that depends on the lateral shift of the load in the lane. This so called shift factor SF is the quotient of the fatigue damage Cv induced by a number of transversely distributed standard axles loads at the most heavily loaded point of a pavement (centre line) . and the fatigue damage Cs caused by the same number of standard axle loads, now assumed to be concentrated in the centre line: SF= Cv c· O~SF:S;1 Equ. 3 $ This so defined reduction factor SF, which is dependent on the lateral shift of the load and the construction type and structure of the pavement as well, can be compared for example with the constant shift factor of 0.40 for lane widths of3.50 m provided by the SPDM - method [8]. By means of theoretical pavement models for asphalt and concrete pavements representative stresses and strains in the centre line, which are induced by a standard load Q. situated at a distance x from the centre line, can be calculated. Material tests show an existing relation between induced strains and the number of allowable load repetitions Nx. Thus the fatigue damage per load repetition C. results from C.=llNx • The relative frequency hex) of a load applied at the distance x from the centre line is given by the Laplace function (Figure 12). Assuming that the 394 Figure 12. Simulation of wheel path distribution in a theoretical pavement model EVALUATION OF THE SHIFT FACTOR The Austrian catalogue of standardised pavements provides three asphalt pavement types, one of them with cement stabilised road base, and two types of concrete pavements. For each pavement type there are five different load categories with different thicknesses of the asphalt or concrete layers. The reduction factor SF was calculated for each pavement type and load category in dependence of the lane width by taking into consideration the findings of the wheel path measurements concerning influence of speed and rutting. Stresses and strains of asphalt pavement types were calculated for different climate conditions by using a multi layer elastic model. Layer stiffness and fatigue properties were set according to the design procedure on which the Austrian standardisation is based on [10]. Theoretical calculations for concrete pavements were made by using the general analytical solution for both interior and edge loading of slabs on an elastic subgrade given in [11]. The results of the calculations can be summarised as follows (see Table 2): - For asphalt pavements with unbound road base provided by the Austrian catalogue of standardised pavements the GEOMETRY AND OTHER ISSUES reduction factor lies between SF = 0.60 - 0.43 in dependence of the load category (thickness of the asphalt layer) and lane width. respective Austrian guidelines for standardised pavements and lead to a correction of the regulations concerning the investigated shift factor SF. - For asphalt pavements with cement stabilised roadbase the shift factor is generally higher . The reduction factor lies between SF = 0.74 - 0.52 in dependence on the load category and lane width. In this case the permitted reduction of the calculated design load is about 25 % less than' for asphalt pavements with unbound road base. The reason for the higher influence of lateral loading applied on pavement types with cement stabilised roadbase can be explained in the higher stiffness of their layer system, that causes a wider spread of the load stresses and strains in the pavement structure. ACKNOWLEDGMENTS The authors wish to thank the Austrian Federal Ministry of Economic Affairs for sponsoring this project and the Road Authorities of the provinces Lower Austria and Burgenland for their great support during the measurement. - For concrete pavements the shift factor lies between SF = 0,48 - 0,25 in dependence on the load category (thickness of concrete slab) and the lane width. In spite of the high stiffness of concrete pavements, lateral loading has less influence on their fatigue, because of their different material properties and damage behaviour. load category I II III IV V I IT III IV V Lane width [m] 3.00 3.25 3.50 3.75 4.00 4.25 aspba1t:.$veri:ientJUDbOond·Subbase 0.60 0.56 0.53 0.51 0.49 0.47 0;48 0.46 0.58 0.54 0.52 0.49 0.54 0.58 0.51 0.49 0.47 0.45 0.57 0.54 0.48 0.51 0.47 0.45 0.52 0.55 0.49 0.46 0.45 0.43 ·asPlWt~eritlc:eincirt~Stibb3se· 0.74 0.71 0.69 0.66 0.65 0.63 0.72 0.68 0.62 0.60 0.66 0.63 0.69 0.66 0.60 0.58 0.63 0.61 0.56 0.54 0.66 0.63 0.60 0.58 0.60 0.64 0.57 0.55 0.54 0.52 ....• !.' I IT III IV+V 0.48 0.46 0.44 0.43 ·C()iiCfet~·· 0.46 0.44 0.42 0.40 0.43 0.41 0.39 0.37 ...... ...:.: .............::.:.. 0.38 0.36 0.34 0.33 0.34 0.32 0.30 0.29 0.29 0.27 0.26 0.25 Table 2. Shift factor SF for different pavement types and load categories (I ... highest, V ... lowest) CONCLUSIONS The measurements of the lateral wheel path distribution reveal a high influence of speed level and rutting beside lane width on the extent of lateral shift of heavy vehicles. Statistical analysis confirm a Laplace distribution of the wheel paths in a lane in opposition to many former publications, which propose a normal or Gauss distribution. Taking into consideration the lateral shift of loading for pavement design the results show a high influence on the recommended layer thickness not only by the extent of the lateral shift but by the construction type and structure of the pavement as well. These findings will be introduced to the . REFERENCES 1. Richtlinien und Vorschriften fur den Strassenbau - RVS Osterreichische Forschungsgesellschaft fur das Verkehrs- und StraBenwesen gemeinsam mit dem Bundesministerium fur Bauten und Technik, Wien. RVS 3.63.: Bautechnische Details, Oberbau, 1986. 2. T ARAGIN, A: Lateral Placements of Trucks on TwoLane Highways and Four-Lane Divided Highways. Public Roads, Volume 30, No. 3,1958. 3. SHANKAR, P.R and LEE, e.E.: Lateral Placement of Truck Wheels within Highway Lanes. Transportation Research Record 1043, Washington D.C. USA, 1985. 4. BENEKOHAL, RF., HALL, K.T. and MILLER, H.W.: Effect. of Lane Widening on Lateral Distribu!i.on .. of Truck Wheels. Transportation Research Record 1286, Washington D.e. USA, 1990. 5. BUlTER, R, CORTENRAAD, W.MH., VAN ECK, AC. and VAN RIJ, H.: Effects of the Transverse Distribution of Heavy Vehicles on the Thickness Design of Full Depth Asphalt Pavements. Paper presented at the 68th Annual Meeting of the Transportation Research Board, Washington D.e. USA, 1989. 6. KNOFLACHER, H.: Beitrag zum Seitenabstandverhalten auf Freilandstrafien. StraBenverkehrstechnik, Heft 111976. 7. BLAB, R: Die Fahrspurverteilung als Einflussgro6e bei der Bemessung des Strafienoberbaus. Dissertation an der Universitat Wien, Fakultat fur Technischen Bauingenieurwesen, Wien, 1995. 8. CLAESSEN ALM, EDWARDS, J.M., SOMMER, P and UGE, P.: Asphalt Pavement Design - The Shell Method. 4th Intern. Conference on the Structural Design of Asphalt Pavements. Vol. I, University of Michigan, Ann Arbor, 1977. 9. MINER, MA: Cumulative Damage in Fatigue. Journal of Applied Mechanics, Volume 12, No. 3, Washington USA, 1945. 10. LITZKA, J.: Die Bemessung des StraBenoberbaues nach der neuen RVS 3.63. Baumaschine, Baugertite, Baustelle, Heft 2, 1987. 11. VAN CAUWELAERT, F.: A Rigorous Analytical Solution of a Concrete Slab submitted to Interior and Edge Loads with No, Partial an~ Full Shear Transfer at the Edge. Proceedings of the Fifth International Conference on Concrete Pavement Design and Rehabilitation, Vol. 1, Purdue University, Indiana USA, 1993. 395


