Supplementary material for “Temperature dependence of the capacitance of a efer
advertisement
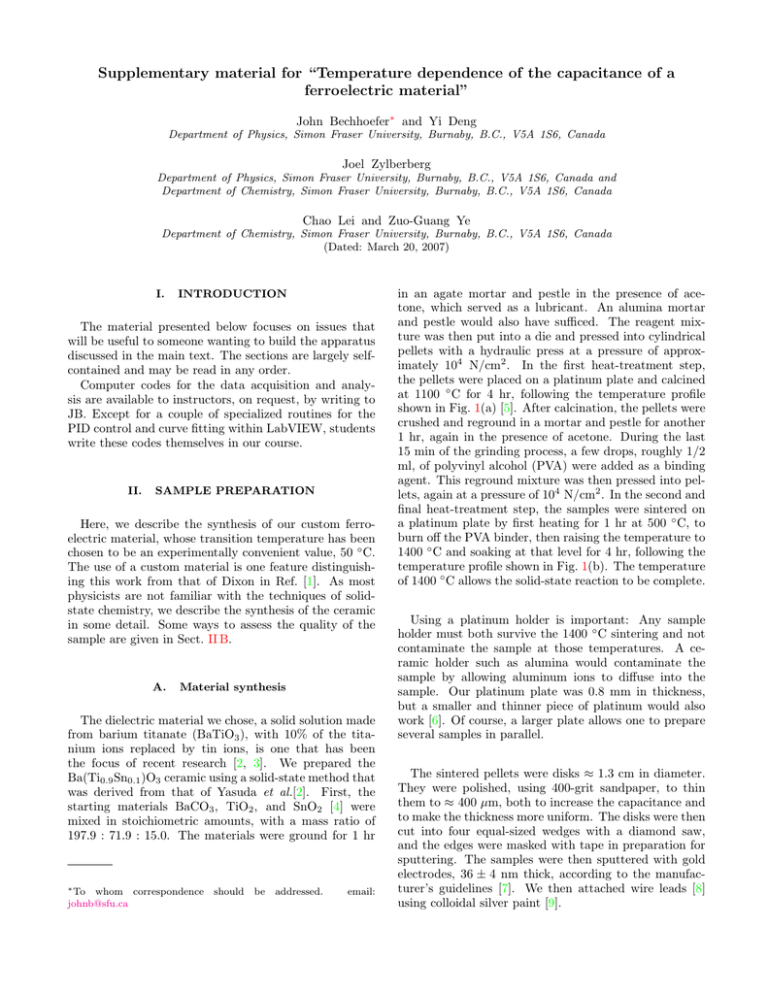
Supplementary material for “Temperature dependence of the capacitance of a ferroelectric material” John Bechhoefer∗ and Yi Deng Department of Physics, Simon Fraser University, Burnaby, B.C., V5A 1S6, Canada Joel Zylberberg Department of Physics, Simon Fraser University, Burnaby, B.C., V5A 1S6, Canada and Department of Chemistry, Simon Fraser University, Burnaby, B.C., V5A 1S6, Canada Chao Lei and Zuo-Guang Ye Department of Chemistry, Simon Fraser University, Burnaby, B.C., V5A 1S6, Canada (Dated: March 20, 2007) I. INTRODUCTION The material presented below focuses on issues that will be useful to someone wanting to build the apparatus discussed in the main text. The sections are largely selfcontained and may be read in any order. Computer codes for the data acquisition and analysis are available to instructors, on request, by writing to JB. Except for a couple of specialized routines for the PID control and curve fitting within LabVIEW, students write these codes themselves in our course. II. SAMPLE PREPARATION Here, we describe the synthesis of our custom ferroelectric material, whose transition temperature has been chosen to be an experimentally convenient value, 50 ◦ C. The use of a custom material is one feature distinguishing this work from that of Dixon in Ref. [1]. As most physicists are not familiar with the techniques of solidstate chemistry, we describe the synthesis of the ceramic in some detail. Some ways to assess the quality of the sample are given in Sect. II B. A. Material synthesis The dielectric material we chose, a solid solution made from barium titanate (BaTiO3 ), with 10% of the titanium ions replaced by tin ions, is one that has been the focus of recent research [2, 3]. We prepared the Ba(Ti0.9 Sn0.1 )O3 ceramic using a solid-state method that was derived from that of Yasuda et al.[2]. First, the starting materials BaCO3 , TiO2 , and SnO2 [4] were mixed in stoichiometric amounts, with a mass ratio of 197.9 : 71.9 : 15.0. The materials were ground for 1 hr ∗ To whom correspondence johnb@sfu.ca should be addressed. email: in an agate mortar and pestle in the presence of acetone, which served as a lubricant. An alumina mortar and pestle would also have sufficed. The reagent mixture was then put into a die and pressed into cylindrical pellets with a hydraulic press at a pressure of approximately 104 N/cm2 . In the first heat-treatment step, the pellets were placed on a platinum plate and calcined at 1100 ◦ C for 4 hr, following the temperature profile shown in Fig. 1(a) [5]. After calcination, the pellets were crushed and reground in a mortar and pestle for another 1 hr, again in the presence of acetone. During the last 15 min of the grinding process, a few drops, roughly 1/2 ml, of polyvinyl alcohol (PVA) were added as a binding agent. This reground mixture was then pressed into pellets, again at a pressure of 104 N/cm2 . In the second and final heat-treatment step, the samples were sintered on a platinum plate by first heating for 1 hr at 500 ◦ C, to burn off the PVA binder, then raising the temperature to 1400 ◦ C and soaking at that level for 4 hr, following the temperature profile shown in Fig. 1(b). The temperature of 1400 ◦ C allows the solid-state reaction to be complete. Using a platinum holder is important: Any sample holder must both survive the 1400 ◦ C sintering and not contaminate the sample at those temperatures. A ceramic holder such as alumina would contaminate the sample by allowing aluminum ions to diffuse into the sample. Our platinum plate was 0.8 mm in thickness, but a smaller and thinner piece of platinum would also work [6]. Of course, a larger plate allows one to prepare several samples in parallel. The sintered pellets were disks ≈ 1.3 cm in diameter. They were polished, using 400-grit sandpaper, to thin them to ≈ 400 µm, both to increase the capacitance and to make the thickness more uniform. The disks were then cut into four equal-sized wedges with a diamond saw, and the edges were masked with tape in preparation for sputtering. The samples were then sputtered with gold electrodes, 36 ± 4 nm thick, according to the manufacturer’s guidelines [7]. We then attached wire leads [8] using colloidal silver paint [9]. 20 5 10 15 30 40 50 60 (310) (220) 0 70 (311) sinter (221) & (300) 1000 (211) 20 (200) 15 PVA burnoff 500 0 0 10 2000 (210) 1000 5 (a) (111) 0 0 (110) calcine 500 intensity (a.u.) 1500 3000 1000 (100) (b) temperature (C) (a) 1500 temperature (C) 2 80 2" (°) 20 time (hr) FIG. 1: Temperature profiles for the preparation of the Ba(Ti0.9 Sn0.1 )O3 ceramics. (a) Calcination. (b) Sintering. The temperature ramps in (a) were +150 and −220◦ C/hr. In (b), they were +150, +200, and −250 ◦ C/hr. B. (b) tan ! 0.02 0.01 Assessment of material quality 0.00 In practice, assessing the quality of the ceramic material is easy: one can simply use the Curie temperature and the width of the transition as a guide. Here, we include some independent ways to assess the quality of the sample that may help if something goes wrong with the synthesis. Figure 2(a) shows a typical x-ray diffraction pattern pattern, taken on a Rigaku diffractometer using Cu-K radiation. The structure of the peaks shows that the lattice is cubic, of perovskite (ABO3 ) structure, with a lattice constant of d = 4.0216 Å. Note that the data are taken at room temperature, where the lattice is in principle orthorhombic. The distortion, however, is small, and the x-ray peaks in Fig. 2(a) are indistinguishable from those of a cubic structure. Apart from a small change in lattice spacing, the peaks match those of pure barium titanate [10]. A second measure of quality is the dielectric loss, usually reported as the tangent of the difference, δ, between the phase lag of an ideal capacitor (90◦ ) and the measured value. The data reported in Fig. 2(b) show this loss to be small. These data may be taken using a lockin amplifier or an LCR meter. Finally, the measured density of the solid serves as a third measure of quality of the sample. Using the extracted lattice constant from the x-ray data, we can obtain a theoretical solid density MBa + 0.9MT i + 0.1MSn + 3MO = 6.135g/cm3 , d · NA (1) with molecular weights MBa = 137.33, MT i = 47.90, MSn = 118.69, and MO = 15.999 g/mol and with NA Avogadro’s number. The density of our material was measured using the fluid-displacement, or Archimedes, method [11] and was 95% of the value in Eq. (1). Collectively, the x-ray diffraction pattern that is characteristic of a pure perovskite structure, the low dielectric loss, and the density that is nearly equal to the theoretical value all indicate that the sample is of high quality. ρ= 0 100 200 temperature (C) FIG. 2: Assessment of sample quality. (a) X-ray diffraction from the Ba (Ti0.9 Sn0.1 )O3 ceramics. (b) Dielectric loss, as a function of temperature. Data taken at 100 kHz. III. EXPERIMENTAL DETAILS In this section, we describe some of the more technical details about sample assembly, associated circuitry, temperature calibration, and the overall experiment-control program. (See Fig. 3 for a schematic.) This material will be essential for those wanting to build and implement the experiments described here. Sample thermistor A/D Computer DAQ D/A Power amp heater capacitor A/D FIG. 3: Schematic of the experimental setup. The actual circuit for the thermistor has another resistor in series, and the voltage is measured across the thermistor. Similarly, the voltage across the capacitor is measured in a series circuit with a resistor. The square excitation for the RC circuit is also generated by the DAQ but not shown on the diagram. The DAQ has an internal pre-amp that is software selectable, also not shown. The three elements of the sample are potted together using an adhesive that provides thermal contact and mechanical stability. 3 A. Sample assembly As mentioned in the main text, the main challenges were to provide mechanical robustness so that the sample could survive sometimes-rough handling by students, give good thermal contact between the heater and both the thermistor and capacitor, and be able to withstand the repeated heat shocks created during heating and cooling cycles. The silver paint provided a good electrical connection between the leads and the capacitor, but the leads could easily be pulled off if the capacitor was handled roughly. The lead for the outer face of the capacitor was bent into a flat coil and glued to the ceramic in an attempt to provide a greater length of wire for bonding. Since such a coil would interfere with the contact between the ceramic and the heater resistor on the inner face of the capacitor, the inner lead was bent into an arc and glued along the lower, curved, edge of the ceramic so that the heater resistor was in direct contact with the ceramic. Care was required when applying the silver paint to prevent the paint from spilling over the edge of the ceramic, thus shorting out the capacitor. In order to provide good thermal contact, the three components—thermistor, resistor, and capacitor—were glued together with a UV-activated adhesive putty [12]. Usually the components could be pressed into good contact by bending the leads but, if not, wrapping thread around the leads just below the components would pull them together. The putty was applied with a toothpick over the components, and on the outer face of the capacitor in an attempt to reinforce the connection of the outer lead. The putty was cured under a UV lamp. Sunlight, if available, should also work. We mounted the sample in an IC socket to prevent stress on the leads, which could fracture the assembly or change the thermal contact [13]. The IC socket containing the samples was mounted in a standard breadboard. We increased the stability of the temperature regulation more than ten-fold by shielding the sample from air currents, using a length of Tygon tubing (3/4” diameter, 1/16” wall, ≈ 1.5” long), with clear tape covering the top. The dimensions of the tubing are such that it stretches over the IC socket, making a good seal. The transparent shielding also leaves the sample visible, which is important in not having it appear to be a “black box” to students. For similar pedagogical reasons, when gluing the components together, we left small bits exposed so that the shapes of each object could be discerned under the adhesive. On the other hand, while the thermal insulation provided by Tygon tubing was a significant improvement compared to not having any insulation at all, it was not good enough to eliminate all effects of environmental perturbations, as we now discuss. B. Comments on the thermal design of the set-up An “ideal” set-up would have equal masses for thermistor and capacitor and equal thermal contacts, or thermal resistances, between each mass and the heater in the center. The thermistor and capacitor would also be subject to identical thermal perturbations. Under all these conditions, the temperature of the capacitor would equal that of the resistor and, thus, the level of temperature control for the capacitor would equal that of the thermistor. In practice, there were two reasons that our control of the capacitor temperature was worse than that of the thermistor: First, when we developed the home-built capacitor discussed in the main text, the new capacitor ended up having a mass roughly three times that of the thermistor. By contrast, in the version of the experiment developed by Dixon in Ref. [1], the masses of the thermistor and capacitor were roughly equal. The inequality in masses meant that the time constant for responding to temperature fluctuations was three times slower for the capacitor than for the thermistor. In principle, we could restore the symmetry in the masses either by reducing the mass of the capacitor or increasing the mass of the thermistor. Doing the former is problematic with the DAQ we chose, as its limited input impedance and A/D sampling rate set a lower limit to the capacitance that could be measured. Reducing the mass of the capacitor would reduce its capacitance and thus increase systematic errors in the capacitance measurement [14]. On the other hand, increasing the mass of the thermistor would result in longer time constants for the temperature-control process. But having short time constants is important for building student intuition into control processes. Thus, in the end, we decided to tolerate a small imbalance in the thermal loads. The second problem, as discussed briefly in the main text, was that our use of a piece of transparent silicone tubing as insulation did not isolate very well the experimental set-up from the environment. Because being able to see the set-up has pedagogical advantages and because the resulting temperature stability of the capacitor was good enough for our purposes, we accepted this compromise. The poor insulation leads to worse temperature control by allowing environmental perturbations that differentially change the temperatures of the thermistor and capacitor. The condition for eliminating such imbalances is that the time constant associated with the insulation from the environment exceed the “internal” time constant for heat to diffuse from the thermistor to the capacitor. This could be achieved, for example, by placing one or more styrofoam coffee cups over the apparatus, as discussed in Ref. [1]. In addition to allowing students to see the apparatus, one other advantage of our “bad” insulation is that blowing sharply on the apparatus from a distance of roughly 10 cm produced “impulse” thermal perturbations of 0.1– 0.2 ◦ C to the thermistor temperature. These could be used to evaluate quickly the quality of the temperature 4 control for a given set of feedback parameters. The cycle of setting feedback parameters, perturbing (blowing), and watching the response took only about 10 s. Students could then easily develop intuitions about the system dynamics and find optimal values for the proportional, integral, and derivative gains. The traditional way to achieve good temperature stability and uniformity is to use a large, high-thermal-conductivity mass for the apparatus, such as a block of copper. The high thermal conductivity of the apparatus then implies small gradients if losses to the environment are low. The latter condition is achieved, as discussed above, by insulating very well the apparatus from the environment. The result, however, is a system with much longer time constants, leading to a much longer cycle for adjusting the feedback parameters. The important point, as discussed in the main text, is that the design compromises we made in trading performance for pedagogy led to a thermal stability for the capacitor that was nonetheless adequate for our purposes. In particular, we could measure the capacitance accurately enough to study its variations in response to controlled temperature changes and to observe slow aging effects when the temperature set-point was held at a fixed value. C. Power amplifier The power amplifier we built used a high-power op amp [15] in a standard single-supply design [16] that was powered by an 18V wall-mount power supply. The circuit has a gain of 2 and can output 0 to 10 V, given the 0-5 V range of the DAQ’s analog output. The amplifier has a source impedance of 0.30 ±0.01 Ω and can drive up to 5 W, which exceeded our needs. The typical thermal resistance between the sample and environment was 60 ◦ C/W, implying that 1.3 W are needed to hold the sample at the maximum working temperature of 100 ◦ C. Since the nominal heater resistance in the sample was 27 Ω, the transient power was limited to about 3.7 W. While this insured that the system responded quickly at the maximum temperature, it also meant that the samples could potentially reach 200 ◦ C if, because of a programming error, etc., the heater was left on at its maximum power. Noting this risk, we urged that students always monitor the output of the power amplifier with a multimeter. The total cost of the amplifier, based on 25 units, was $60/unit for hardware costs and 1.5 hours/unit for labor, including design, circuit layout, assembly, and testing. Apart from the sample itself, the power amplifier was the only special equipment required for the experiment. We consider the computer and DAQ to be standard equipment, as all experiments in the course use these. D. Temperature and heater calibration In the first session, the students characterize the thermal part of the sample system, doing the following steps: 1. Calibrate the temperature input. (a) The temperature sensor is a thermistor [17] with nominal resistance of 10 kΩ at 25 ◦ C. The first task is to convert from resistance to temperature, using the well-known Steinhart-Hart formula [17], with coefficients taken from the manufacturer’s data sheet. The thermistor calibration requires, in addition, a measurement of the actual resistance at 25 ◦ C. Using a mercury thermometer of 0.1 ◦ C precision, students measure the ambient temperature, ≈ 21◦ C, and then, simultaneously, the resistance of the thermistor using a digital multimeter. The value of the reference resistance in the Steinhart-Hart formula is then adjusted so that the inferred temperature matches the mercury reference. (b) In order to make computerized temperature measurements, the thermistor is placed in a voltage-divider circuit in series with a 2.5 kΩ resistor, using the DAQ’s 5-V power supply output as a voltage source. This gives a nearly optimal voltage range for the expected resistance variation, which is 0.3 to 12 kΩ, for 10 to 130 ◦ C. A good problem for students is to show that if the temperature ranges between T1 and T2 , then the value of the reference resistance that maximizes the voltage range is p R(T1 )R(T2 ), where R(T ) is the thermistor resistance at temperature T . (c) Students then generate a look-up table of 100 points to convert from the voltage measured at the output of the voltage divider to a temperature. The look-up table is imported into the LabVIEW Express VI that reads the temperature. Curiously, combining the SteinhartHart formula with the voltage-divider formula tends to cancel out the nonlinearities of each formula, leaving a nearly linear relation between the thermistor temperature and the voltage output of the divider [18]. In any case, we used the full expression to generate the look-up table. Alternatively, instead of a look-up table, one could use a formula node within LabVIEW. 2. Calibrate the power output. The students follow a similar procedure for the output, using P = G2 V 2 /Rheater , where P is the power dissipated through the resistor, V is the voltage output from the DAQ, G is the power-amplifier gain, 2.0 in our case, and Rheater is the heater’s resistance. Again, 5 one generates a look-up table included in a LabVIEW Express VI task for analog output. 3. Verify the linearity of the thermal system. Having calibrated the system’s input and output, one can measure the steady-state temperature as a function of the power input. As one expects from a simple thermal model, the rise is linear. Using a short length of transparent Tygon tubing as insulation from the ambient environment, as discussed above, one finds a typical thermal resistance of 60 ◦ C/W. 4. Explore the effects of temperature averaging. See the main text. E. Experiment control Here, we give details about the control program. As briefly mentioned in the main text, its original feature is the emphasis on state-machine architecture. This is a method that allows real-time control, with interrupts that direct the program to do different things, depending not only on the current “state” of the experiment but also on what has happened before. The program has three parts: an initialization routine that reads in parameters such as the number of temperature readings to be taken and the lower and upper temperature-sweep limits; a main loop, where all the main experimental tasks are addressed; and a shut-down routine that turns the heater off, for safety. The main loop executes at 5 Hz. Each time through the main loop, the following steps are executed: 1. The program takes 2000 temperature readings at 48 kHz and then averages them. 2. Using the PID algorithm discussed above, the program computes and outputs the appropriate heater power. 3. Using a software-generated square wave as both trigger and input to the RC circuit, the program waits for a downward edge and then reads 200 voltages at 48 kHz to record the decay of the voltage across the capacitor. 4. The program then does a nonlinear least-squares curve fit, using the Levenburg-Marquardt algorithm, to extract the time constant for the decay. A nonlinear curve fit is used because the background voltage is not known a priori [19]. 5. The program writes the time, temperature, power, and decay constant to disk. 6. A control-logic section decides whether to do nothing, alter the setpoint, or end the experiment. There are many possible conditions that can be used here. We ask the students to use the dwell time at one temperature as a criterion for changing the set-point. In other words, the program should not change the set-point until a given time—usually 30 s—has passed. Alternatively, one could use the temperature or capacitance stability over a time window as a criterion. All of the above steps need to execute within the 200 ms cycle time of the loop. We chose the 200 ms figure because, on our system, this was the shortest loop time that could be reliably executed. Although the speed of the computer plays a role in determining this figure, we also found that limitations of our DAQ, as discussed below in Sec. IV, were also important. In any case, 200 ms is short compared to the fastest thermal relaxation times, a couple of seconds. More professional, and expensive, “real-time” DAQs have on-board processors that allow much faster loop times. F. Data analysis As discussed in the main text, we used Igor Pro [20] to analyze the data acquired using LabVIEW [21]. Although either program is capable of acquiring and analyzing the data on its own, using two separate programs emphasizes that the conceptual distinction between the two activities. We have also found that students respond differently to the two programs, tending to prefer one or the other according to whether it bests suits their style of thinking. LabVIEW uses graphical programming and appeals to more visually minded students. Igor uses traditional command-line programming, aided by codegeneration techniques, and appeals to students who like text-based approaches. One small practical matter was that our Department has an educational license for Igor that allows students to install a personal copy of the program on their home computer. This means that we can assign the Igor programming tasks before the lab session where it is used. We supply the students with small samples of data to test their programs beforehand. Asking the students to do data analysis beforehand seems to work well, pedagogically. IV. CHOICE OF DAQ Here, we give some notes on our choice of DAQ, the USB-6009, from National Instruments [22]. Our main reasons were that it had enough features to make possible our application, at a low price. Features that were useful include having two analog outputs, 48 kHz analog input at 14 bits, a triggered read capability, and a regulated 5V power supply. At the same time, it is worth noting some limitations that are not present in more expensive DAQs and required some effort to work around: 1. The input impedance is low, Rin ≈ 300 kΩ for differential input. In Ref. [1], the solution is to 6 use an electronic buffer circuit, but our students have not taken an electronics course and thus have not learned about operational amplifiers. We chose instead to have the students consider the effects of finite input impedance and take them into account in the analysis. The 48-kHz sampling rate of the DAQ implies that the decay time constant should be greater than 0.1 ms. If the capacitor’s lateral dimensions are to be comparable to the resistor-thermistor size (. 1 cm), the capacitance C ≈ 1 nF. These constraints imply a circuit impedance R ≈ 100 kΩ, which is comparable to Rin . The measured time constant will then be significantly different from the naive prediction, RC. Other DAQs with Rin ≈ 10 MΩ would not have this problem. In practice, one can calibrate the measured time constants to an absolute capacitance, using a digital multimeter at room temperature. the same output to trigger the acquisition and supply the input voltage to the RC circuit. Thus, we could not systematically explore the effects of varying the voltage to the RC circuit. As our applied fields of . 100 V/cm were always less than typical coercive fields of 103 –104 V/cm, this was not an important limitation. 4. The analog input was 14 bits at 48√kHz, with an RMS noise density of about 1.7 µV/ Hz. This is a hundred times higher than the Johnson noise of the thermistor, implying that our temperature control is limited by the DAQ electronics. While DAQs with lower analog-input noise exist, the drifts in capacitance due to aging were large, so that our temperature control was good enough. 3. There was only a hardware trigger. Had a software trigger been present, we would not have had to use Thus, in the end, while these limitations of our chosen DAQ implied some inconvenience for students, they did not pose fundamental limitations on the results of the experiment. Still, a better DAQ—particularly, one with a waveform buffer on the analog output—would have improved pedagogy, We note that an alternative DAQ from Data Translation has higher input impedance and a waveform buffer, but costs only slightly more [23]. We have not tested this unit ourselves and, in particular, cannot comment as to whether the Data Translation LabVIEW drivers are as easy to use as the NI-DAQmx Express VIs used for the USB-6009, and other NI DAQs. This ease of use was important because we tried to limit the LabVIEW programming to what could be done in about 1.5 hr/ session. [1] P. K. Dixon, “The bug: a temperature-controlled experiment on a protoboard,” Am. J. Phys. 75, XXX–XXX (2007). [2] N. Yasuda, H. Ohwa, and S. Asano, “Dielectric properties and phase transitions of Ba(Ti1−x Snx )O3 solid solution,” Jap. J. Appl. Phys. I 35, 5099–5103 (1996). [3] A. A. Bokov and Z.-G. Ye, “Recent progress in relaxor ferroelectrics with perovskite structure,” J. Mat. Sci. 41, 31–52 (2006). [4] BaCO3 (99.9%, Alfa Aesar), TiO2 (99.9%, High Purity Chemicals Co., a division of Kojundo Chem. Co., Ltd.), and SnO2 (99.9%, Alfa Aesar). See www.alfa.com and www.kojundo.co.jp/e. [5] Calcination allows one to grind the raw materials finely enough that, when sintered, all components can diffuse to equilibrium. [6] For example, a 1.5 cm diameter disk, 0.25 mm thick, would have a mass of ≈ 1 gm. [7] Anatech Hummer 6.2 user manual. See www.anatechltd. com. [8] We used stripped #22 hook-up wire as capacitor leads. [9] Acheson Colloids Electrodag 415 conductive silver paint. In [2], the authors skip the sputtering step and use silver paint to attach the leads directly. [10] The data for pure BaTiO3 were obtained from the In- organic Crystal Structure Database, http://icsdweb. fiz-karlsruhe.de/. [11] G. J. Shugar and J. T. Ballinger, Chemical Technicians’ Ready Reference Handbook, 3rd ed. (McGraw Hill, New York, 1990). [12] Bondo No. 930C sun activated glazing and spot putty. See www.bondo-online.com. The choice of adhesive turned out to be important. The adhesive must be rigid enough to keep mechanical contact, yet flexible enough to avoid fracturing under heat stress. Moreover, the adhesive must keep these properties over repeated temperature cycles. The requirement for flexibility rules out glues such as cyanoacrylates such as “Superglue” and ceramic adhesives. Ordinary epoxies gradually decompose, becoming more brittle, and eventually fracturing under heat or mechanical stress. On the other hand, silicones survive high temperatures but are too flexible to keep components in good thermal contact with each other. The putty we chose works, although it shows extensive decomposition at 100 ◦ C. In the main text, we show results at 120 ◦ C, where the relaxation is faster. Although the sample survived, the extensive decomposition led us to ask the students to limit the maximum temperature to 100 ◦ C. The adhesive used by Dixon [1] is not readily available in Canada but apparently works better. 2. The analog output does not have a waveform buffer. Thus, we had to generate the square wave output in software that continually called the output. This was a drain on software resources that led to occasional timing glitches that in turn created glitches in the capacitance. These would have been eliminated in a DAQ with waveform buffer, where a waveform is output continually after being initially downloaded. Because the glitches were infrequent, they could be eliminated as outlier points. 7 [13] ACT, Model DM-314STG30 14-pin low-profile IC socket. It was important to use a socket with strong legs that can be repeatedly inserted into breadboards. Sockets with spring contacts did not work—the component leads tended to pop out of the spring contacts. Although only 6 pins are used, the extra pins made it easier to handle and insert the sockets. [14] The problem of systematic errors in the measurements of small capacitance is actually worse than one might guess looking at the RC decays presented in the main article. As the impedance of the RC circuit increases, the A/D input of the NI 6809 DAQ shows oscillations of ever greater amplitude. These are already apparent if one looks carefully at Fig. [2] of the main article, where small, fast oscillations can be seen imposed on the main signal. The oscillations become significantly worse at smaller impedances. One cannot simply raise the series resistance of the RC circuit since the maximum 48-kHz sampling rate of the A/D sets a lower limit to the time constant that can be accurately measured. It is important to note that the above limitations reflect highly specific features of the DAQ we chose and that, in the near future, one expects the performance of even entry-level DAQs to improve. Using a buffer would solve the problem, too. See Section IV for more discussion about our choice of DAQ. [15] National Semiconductor, LM675. This op-amp is nominally stable for gains of 10 or greater, while we use a gain of 2. However, in the end, no instability was observed in the final design. The bandwidth is about 3 MHz, far greater than needed (1 kHz). [16] “Single-supply operation of operational amplifiers,” Burr-Brown Application Bulletin, 1986. [17] Vishay BCcomponents, “NTC Accuracy Line.” The coefficients for the resistance-temperature conversion, along with the explicit form of the Steinhart-Hart formula, are given in the manufacturer’s data sheet. See www.vishay. com [18] B. C. Baker, “Thermistors in single supply temperature sensing circuits,” Microchip Application Note 685, Microchip Technology, Inc. (1999). See www.microchip.com. This kind of “hardware linearization” of the thermistor output used to be a much-studied art. With the ease of implementing look-up tables, this approach is mostly obsolete. One case for making an approximate linearization is that the noise characteristics will then be more uniform over the temperature range used. [19] The student version of LabVIEW does not include the package for nonlinear least-squares curve fitting, but the Departmental educational license does. Including the nonlinear fits in the program is important, as one can see the evolution of time constants in “real time.” If the analysis package is not present, students can adjust the circuit voltages in the RC circuit so that the decay is to 0V, by using an external, floating power supply. Then one can take the logarithm and use the linear least-squares fit algorithm, which is included in all LabVIEW versions. The reason that the decay is not normally to 0V lies in details of the detailed input circuitry of the DAQ we use. If we used DAQs with much higher input impedances, we would not have to worry about this issue. [20] WaveMetrics, Igor Pro, v. 5.04b. www.wavemetrics.com. [21] National Instruments, LabVIEW, v. 8.0. www.ni.com. [22] National Instruments, Model USB 6009. www.ni.com. [23] Data Translation, Model DT9812-10V. www.datx.com.
![Sample_hold[1]](http://s2.studylib.net/store/data/005360237_1-66a09447be9ffd6ace4f3f67c2fef5c7-300x300.png)
