Economic Feasibility of Producing Oysters Using a Small-Scale Hawaiian Fishpond Model Jessie Chen
advertisement
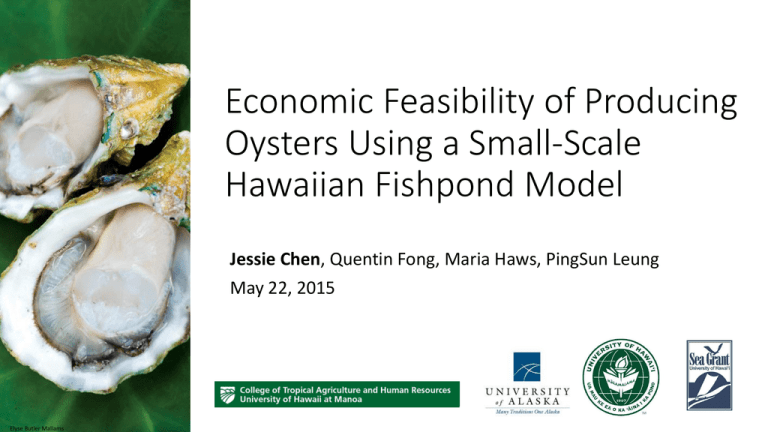
Economic Feasibility of Producing Oysters Using a Small-Scale Hawaiian Fishpond Model Jessie Chen, Quentin Fong, Maria Haws, PingSun Leung May 22, 2015 Elyse Butler Mallams “Local” is everywhere Image: hdoa.Hawaii.gov Why local matters Skilled jobs “By producing more seafood locally we can generate more revenues, create more high-wage, skilled jobs, reduce our reliance on imported seafood, and we can have better control of the product quality. It is also in line with the State’s food selfsufficiency initiative and will help redevelop a strong regional food system in Hawaii.” Elyse Butler Mallams Reduce imports Quality control Sdimportexport.com Self-sufficiency Hawaiian farmed seafood What is missing? Chinese Catfish Image: Blue Ocean Mariculture Limu Pacific White Shrimp Moi Image: Kauai Shrimp Image: Bryan Harry Image: Hawaii.edu Bivalve shellfish: Clams, oysters Clams Image: Kauai Shrimp Pacific Oyster Image: Elyse Butler Mallams Missing oyster industry • Last bivalve shellfish operation in the state closed gates in 1997 for “financial reasons” • Possibly due to high labor and utility cost share of Hawaiian aquaculture, estimated at 42% and 14%, respectively (Naumasa, Arita, Tamaru, & Leung, 2013) Clams • DOH laboratory certification lapsed in 2000 Image: Kauai Shrimp This is no longer the case. In 2014 DOH approved the production and sale of clams at a location in Kauai Major gap inPacific knowledge Oyster Image: Elyse Butler Mallams Resident consumption “We’re not going to be able to supply our own need for a while. We import close to 400,000 oysters every month in Hawaii. That’s a heck of a lot of oysters,” (Haws, 2013) 740,755 pounds per year 5.3 million pounds 139 million pounds of clams Loke, Geslani, Takenaka, & Leung (2012) Advantages of growing in Hawaiian fishponds 2010 Deepwater Horizon oil spill Eoearth.org Louisiana has continually seen decreased harvests of Eastern oysters, compared to historical figures (Gothreaux & Banks, 2014). Larval oyster death correlated to high energy expenditure, a problem exacerbated by attempts to sequester calcifying agents from mineral-poor, acidified ocean water (Waldbusser et al., 2013). Advantages of growing in Hawaiian fishponds Using fishponds does not require water pumping or algal feed, which were components of past land-based methods in HI (Yamauchi, Lee, & Gee, 1983). Objectives Floating oyster cages in fishpond 1. Calculate pre-tax return 2. Determine sensitive input parameters affecting MIRR 3. Provide information to stakeholders on viability of a Hawaiian oyster industry NASA Hypothesis: Oysters grown in Hawaiian fishponds are economically competitive to those grown in other areas, in terms of production costs and profitability. Depuration tank for final treatment Sorting and grading Methods Collect “farm-gate” cost data from currently operating small-scale oyster producer defined as 50,000 - 250,000 marketready specimens per year (Hudson et al., 2012) Taylorshellfishfarms.com Methods Construct spreadsheet-based enterprise budget for model case Assumptions: Taylorshellfishfarms.com • 50% mortality rate • Target sales of 156,000 individuals (3000/week) • Market price of $1.25 • Operates 10 years • At 3X current production Methods Conduct sensitivity analysis to address parameters affecting MIRR Assumptions: • 6% reinvestment rate • 6% finance rate Methods Conduct budget evaluation to identify major costs Results: Net pre-tax return Materials & - Methods $195,000.00 $153,529.44 $34,433.22 $16,506.50 -$9,469.16 Net pre-tax return Income Operating Expenses Fixed Costs Permitting Costs Results: Major costs Triploid oyster seed: 5.3% Full-time labor: 23.9% Part-time labor: 17.9% Fringe Benefits: 20.9% Total: 62.7% Rent: 12.2% Ground/water lease: 3.5% Private testing: 0.2% Fringe Benefits: 4.4% Total: 8.1% 30% 20% 10% MIRR: -7.7% MIRR 0% MIRR Sensitivity Baseline parameter value (0% change) ------------------------------------------- Results: Sensitivity analysis -50% -45% -40% -35% -30% -25% -20% -15% -10% -5% 0% 5% 10% 15% 20% 25% 30% 35% 40% 45% 50% -10% -20% -30% Market Price ($/oyster) Mortality Rate (% of cohort) Oyster Seed ($/1000) PT Wage ($/hr) Electricity ($/kWh) Water ($/1000gal) Rent ($/acre) Results: Decision Reversal Analysis Parameter Market Price ($/oyster) Mortality Rate (% annually) Oyster Seed ($/1000) PT wage ($/hr) Electricity ($/kWh) Water ($/1000 gal) Rent ($/acre) Baseline 1.25 50 35.00 13.00 0.21 4.96 500.00 Decision Reversal: % Change MIRR = 6% from baseline 1.35 8.00% 45.86 -8.28% -15.92 -145.49% 9.24 -28.92% -2.064133 -1067.64% -105.49 -2226.89% 182.32 -63.54% Discussion The model farm appears unprofitable, but marginally Profitability is highly dependent on 3 key variables: • Mortality rate • Market price • PT labor rate Labor continues to represent the highest cost share in budget. Electric and water costs represent smaller portion of total budget than in past aquaculture operations Conclusion • Farming in fishponds is distinct from past, land-based methods of oyster culture • No need for feed facilities; cost avoidance suggests an advantage over past operations • A successful threefold expansion of production does not triple total costs, suggesting economy of scale – expansion as next step? • Addressing most sensitive parameters is key to profitable enterprise example: Ability to capture price premium on differentiated, “Hawaii-grown” oyster is key Mahalo! Many thanks to Dr. PingSun Leung, Dr. Maria Haws of the University of Hilo, and Dr. Quentin Fong of the University of Alaska, Fairbanks, who have provided invaluable insight and support. Mahalo to the employees at the fishpond for allowing us to observe their operations. Mahalo to the UH Sea Grant, Project R/SS-11, for their generous funding, and for believing in this project. References Gothreaux, C., & Banks, P. (2014). Aquaculture and Louisiana Fisheries: Innovative Oil Spill Rehabilitation Efforts. Fisheries, 39(11), 536-540. Haws, M. (2013). Fledgling oyster industry comes out of its shell/ Interviewer: Stewart, C. [Online news article]. Hawaii Tribune Herald. Retrieved from http://hawaiitribune-herald.com/sections/news/local-news/fledgling-oysterindustry-comes-out-its-shell.html. Hudson, K., Kauffman, D., Murray, T. J., & Solomon, A. (2012). 2012 Cultchless (Single-Seed) Oyster Crop Budgets for Virginia: User Manual. Loke, M., Geslani, C., Takenaka, B., & Leung, P. S. (2012). Seafood consumption and supply sources in Hawai ‘i, 2000–2009. Marine Fisheries Review, 74(4), 44-51. Naomasa, E., Arita, S., Tamaru, C., & Leung, P. (2013). Assessing Hawaii's aquaculture farm and industry performance. Aquaculture Economics & Management, 17(2), 184-207. Waldbusser, G., Brunner, E., Haley, B., Hales, B., Langdon, C., & Prahl, F. (2013). A developmental and energetic basis linking larval oyster shell formation to acidification sensitivity. Geophysical Research Letters, 40(10), 2171-2176. Yamauchi, H., Lee, K. K., & Gee, H. K. (1983). An overview of land-based oyster aquaculture in Hawaii. Research extension series-Hawaii Institute of Tropical Agriculture and Human Resources (USA). no. 029.
